Download
1 / 24
240 likes | 351 Views
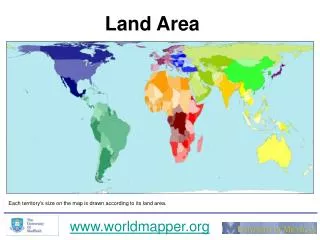
How to value ecosystem goods and services in agriculture at increasing land use pressure ? Katarina Hedlund Lund university, Sweden. Land use projections. Production of goods is increasing Food, biofuels, timber, water use Natural habitats are declining Mitigating climate change

E N D
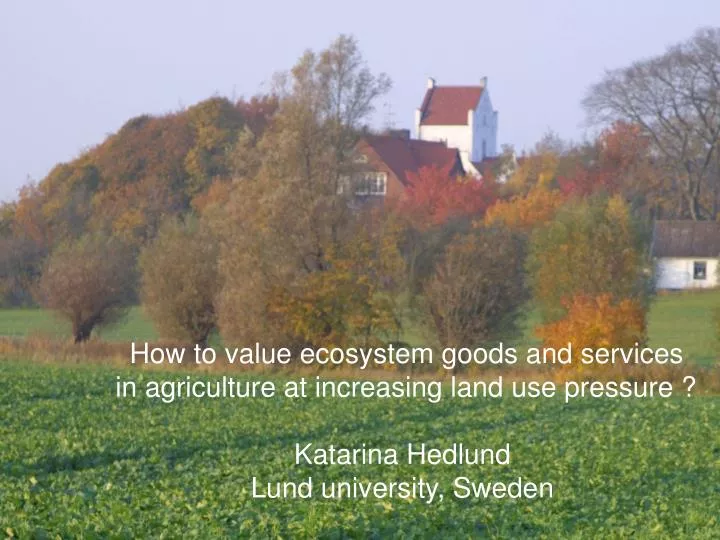
How to value ecosystem goods and services in agriculture at increasing land use pressure ? Katarina Hedlund Lund university, Sweden
Land use projections • Production of goods is increasing • Food, biofuels, timber, water use • Natural habitats are declining • Mitigating climate change • Increased pressure on land for production of biomass
Agricultural land use EU biofuel strategy • 1% (produced in EU) • 6% 10% of total area 2020 10% 43% of total area Nowicki 2006
Eurostat 2008 Current land use in Europe
Land use demands Biofuel production Agriculture Natural grasslands
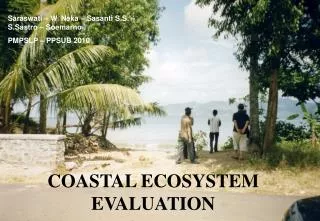
Extensive agriculture, Dehesas in Spain How do we conserve ecosystem services and biodiversity ? Agri-environmental schemes: Heterogeneity in landscapes Extensification Protected areas
EU common agricultural policy CAP • Implemented nationally as rural development plans with additional national funding • CAP (12 000 million €/yr), 47% of EU budget • Farming is 5% of European economy • CAP subsidies • Area based income support • Rural development actions • Agri-environmental schemes
Ecosystem services threatened byintensive agriculture • Natural enemies • Pollination • Resistance to pests & invasive species • Nutrient cycling • Water retention • Carbon retention
Intensification and above ground services • Increased heterogeneity may give higher diversity • Effect is scale dependent • Not true for all species Tscharnkte et al. 2007
Soil ecosystem services • Nutrient cycling • N, P retention and availability to plants • Water retention • Aggregate structure, organic matter • Carbon retention • Fuels microbial activity, mitigates climate change
Soil services Reduced under intensive management Hedlund 2002
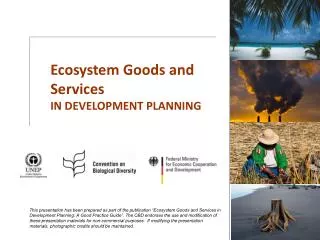
SOILSERVICEConflicting demands of land use: Soil biodiversity and the sustainable delivery of ecosystem goods and services in Europe • value soil ecosystem services. • predict sustainability of ecosystem services, by field and modelling studies. • Build scenarios to identify economical and social drivers of land use http://www.kem.ekol.lu.se/soilservice/index.html
Soil carbon Nutrients Natural enemies Pollination Land use demands Biofuel production Agriculture Natural grasslands
Valuation of ecological services Market values of ecological services prevention of pests - natural enemies pollination water retention nutrient retention Non market values recreation landscapes Markanday et al 2008
Economic valuationa dynamic approach • Ecosystem services in agriculture • - Dynamic network of interacting organisms • Responding to changes in land use • Depending on spatial and temporal scales
SOILSERVICE • Economic model • simulated landscapes • predicts regional land use (20 yrs) • Ecological model • farmers scale • predicts output of • ecosystem services Values of services for farmer and society Predictions on sustainability Feed back to policymakers
AgriPoliS Agent-based model of regional structural changeover time and space Factor endowment Interactions Farms Actions Agricultural Policy Simulator (Happe 2004, Brady et al 2007) Institute of Agricultural Development in Central and Eastern Europe (IAMO), Halle, Germany
Exogenous Prices of inputs/outputs Wage and interest rates Agricultural policy Climate Technology Endogenous Land market Regional markets Input & output levels Land use Landscape impacts ES production Drivers in relation to AgriPoliS
Farm structure Average farm size Number of farms Distribution of farm type Land use Composition of crops Distribution of field size Landscape mosaic Econ. Performance Land rents by soil type Farm income Farm profit Investment activity Returns to labour Livestock Numbers of livestock Animal density Output from AgriPoliS
SOILSERVICE field sites Regions for valuation of services
SOILSERVICE partners • Lund University, Sweden, Dr Katarina Hedlund • Swedish Institute for Food and Agricultural Economics, Sweden • Dr. Mark Brady, • University of Copenhagen, Denmark Prof. Søren Christensen, • University of Helsinki, Finland Prof. Heikki Setälä, • Netherlands Institute of Ecology, NL, Prof. Wim H. Van der Putten, • Wageningen University, NL, Prof. Peter C. de Ruiter, • Justus-Liebig-University of Giessen, Germany, Prof. Volkmar Wolters, • Biology Centre of the Academy of Sciences, Czech Republic Dr. Jan Frouz, • Aristotle University of Thessaloniki, Greece, Dr. Stefanos Sgardelis • Lancaster University, United Kingdom, Prof. Richard D. Bardgett • University of Reading, United Kingdom, Dr. Simon Mortimer
Land use data (GIS based)Southern Sweden Cereal production Grasslands