Download
1 / 23
240 likes | 503 Views
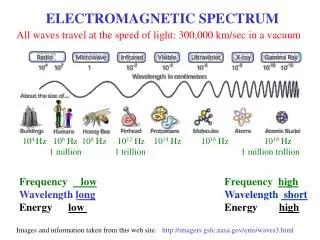
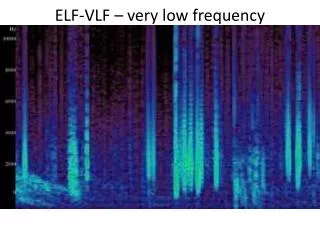
Very Low Frequency Astronomy. Or how to observe at work on a cloudy day!. The Radio Spectrum. The Ionosphere VLF are opaque to the ionosphere Therefore VLF Astronomy is by its nature an indirect method of observing. E Layer. D Layer. Quiet Sun.

E N D
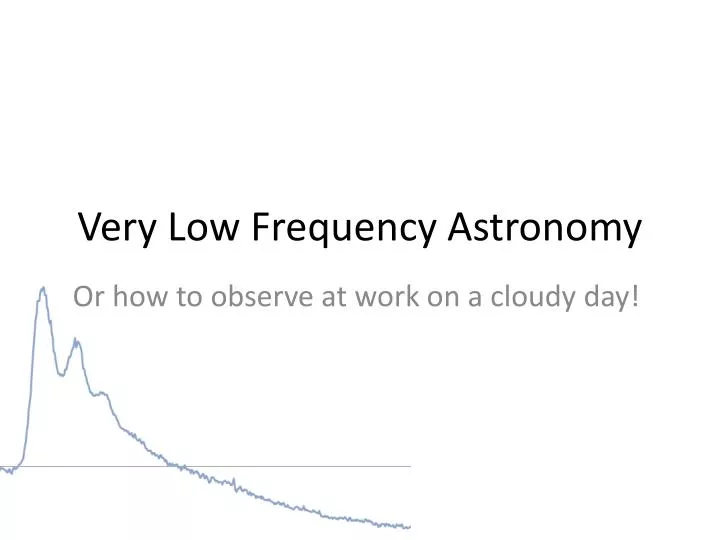
Very Low Frequency Astronomy Or how to observe at work on a cloudy day!
The Ionosphere • VLF are opaque to the ionosphere • Therefore VLF Astronomy is by its nature an indirect method of observing E Layer D Layer
Quiet Sun Low level of Sky-wave signal Vs. ground-wave
At Night Erratic level of Sky-wave signal Vs. Constant ground-wave
Active Sun High level of Sky-wave signal received during flare
Most people think radio astronomy think is complicated Colin Clements 4Ghz Radio Telescope But it doesn’t have to be...
Radio Equipment Antenna Recorder PC Receiver Larger the better More turns the better I have three 128 turns 400x400 square tuned antenna 25 turns 600mm Diameter circle un-tuned 150 turns 600mm diameter circle untuned Receiver Two approaches radio receiver tuned to a specific station, outputs signal strength PC sound card Recorder Two approaches Data logger PC
My UKRAA VLF Receiver Antenna Aerial Tuning Unit Receiver Data logger/controller
My Natural Radio Spectrum Set-up Antenna Soundcard
Live power spectrum, peaks are radio transmitters Waterfall shows how the power changes with time SpectrumLab Freeware Running on an old laptop Win98 (first Edition) 192MB RAM Pentium II 400MHz processor 6GB Harddisk Up to 100 plotters can be set to record the power at specific frequencies / bands of frequency
Radio Stations • 19.6kHz GBZ, Anthorn,UK • 20.27kHz ICV, Isola di Tavolara, Italy • 20.9kHz FTA, Sainte-Assise, France • 21.75kHz HWU, Rosnay, France • 22.1kHz GQD, 22,.1kHz Skelton, UK • 23.4kHz DHO38 Rhauderfehn, Germany • 24Khz NAA, Cutler, Maine, USA • 37.5kHz, NRK/TFK Grindavik, Iceland • 62.6kHz, La Regine, France • 81kHz, Inskip, UK
Recording & Interpreting Results • Amplitude of event • Corresponds (usually) to the flare class, but will be specific to conditions and observer • Start, Peak & End of event • Recorded as an importance level Increasing Energy A text book SID Importance = 2+ 2011-02-28 12:46 – 12:54 – 13:48 Corresponded to a M1 event
Typical Quiet Day Transmitter is turned off at 07:00 – 08:00 every day
Removing signals after sunset and the signals that are not showing useful information can make it easier to see what is going on.
Next Steps for VLF • Get laptop set-up in shed and connected via wifi to main PC • Get lap-top controlling UKRAA controller • Build VLF set-up for CMHAS observatory • Experiment with different antenna configurations • Automate logging and access via web
Future Projects for Radio Astronomy • Meteor Detection • Solar activity monitor (21Mhz) • Radio Jove (21Mhz) • Radio Imaging