Download
1 / 14
140 likes | 151 Views
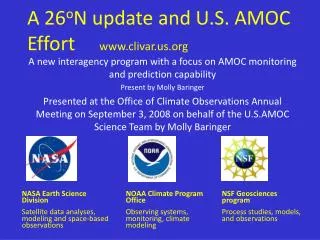
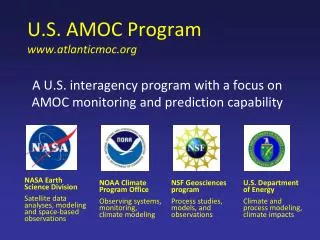
CLIVAR Summit 7/2009. U.S. AMOC Effort. (www.atlanticmoc.org) An interagency program with a focus on AMOC monitoring and prediction capability Linkages to USCLIVAR U.S.AMOC Science Team: chair Susan Lozier {Presented by Jim Carton}. NASA Earth Science Division

E N D
CLIVAR Summit 7/2009 U.S. AMOC Effort (www.atlanticmoc.org) An interagency program with a focus on AMOC monitoring and prediction capability Linkages to USCLIVAR U.S.AMOC Science Team: chair Susan Lozier {Presented by Jim Carton} NASA Earth Science Division Satellite data analyses, modeling and space-based observations NOAA Climate Program Office Observing systems, monitoring, climate modeling NSF Geosciences program Process studies, models, and observations
Unanswered questions surrounding the AMOC include: • What is the current state of the AMOC? • How has the AMOC varied in the past on interannual to centennial time scales? • What governs AMOC changes? • Is the AMOC predictable on 10-100 year timescales? • What are the impacts of AMOC variability and change on climate? October 2007: Implementation Strategy for a JSOST Near-Term Priority: Assessing Meridional Overturnng Circulation Variability: Implication for Rapid Climate Change
U.S. AMOC Scientific Objectives • Design and implementation of an AMOC monitoring system [link to POS] • Assessment of AMOC’s role in the global climate • Assessment of AMOC predictability [Link to WGDP] Recommended Activities • Develop an AMOC state estimate or “fingerprint” • Monitor AMOC transports • Evaluate coherence and connectivity of AMOC circulation and transports • Assess AMOC observing systems with ocean models • Reconstruct AMOC variability and associated property fields • Model the ocean state during the instrumental period • Develop longer-term proxies for AMOC variability • Diagnose mechanisms of AMOC variability and change • Assess AMOC predictability • Determine impact and feedback of AMOC variability • Assess role of AMOC in producing observed changes
NOAA/funded Western Boundary Time Series Array funded: 2004-2014
Western Boundary Time Series (WBTS) U.S. PI’s: M. O. Baringer1, C. S. Meinen1, S. L. Garzoli1 1 NOAA-Atlantic Oceanographic and Meteorological Laboratory U.S. Collaborators: B. Johns2, L. Beal2 (MOCHA/NSF) 2 RSMAS, University of Miami, Miami FL International Collaborators: H. Bryden3, S. Cunningham3, T. Kanzow3, J. Marotzke4, J. Hirschi3 (RAPID/NERC) 3 National Oceanography Centre, Southampton, U.K. 4 Max Planck Institut, Hamburg, Germany
Line W: A sustained measurement program sampling the North Atlantic Deep Western Boundary Current and Gulf Stream at 39°N U.S. PI’s: J. Toole1, R. Curry1, T. Joyce1, M. McCartney1 and W. Smethie, Jr.2 1 Woods Hole Oceanographic Institution, Woods Hole, MA 02543 2 Lamont Doherty Earth Observatory, Palisades, NY 10964 International PI’s: J. Smith3 3 Bedford Institute of Oceanography, Dartmouth, Nova Scotia B2Y 4T3 Canada Line W Volume transport time series
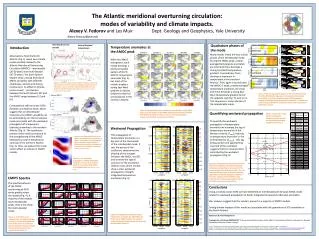
Evaluation of Meridional Transport of Water and Heat in the Atlantic Ocean Using Satellite Data PI: W. Timothy Liu, Co-I: XiaosuXie 1 Jet Propulsion Laboratory, NASA, Pasadena, California Comparing annual mean Atlantic meridional heat transport. Red curve is calculated from four components of satellite surface heat flux. The green curve is computed from ECCO data. Various symbols are from past studies, from surface heat flux or hydrographic data.
Pathways of meridional circulation in the North Atlantic Ocean U.S. PI’s: P.B. Rhines1, S. Hakkinen2 1 Dept of Oceanography, U. Washington, Seattle, WA 2 NASA Goddard Space Flight Center, Greenbelt, MD Surface drifter tracks show significant changes since year 2000 in the path of the surface currents associated with the North Atlantic Current. Surface drifter tracks entering (cyan) and leaving (magenta) the region (30-50W, 35-45N): during 1991-2000, top, and during 2001-2006, bottom.
LC NAC subtropical strong NAC weak subtropical Assessing Meridional Transports in the North Atlantic Ocean U.S. PI’s: K. A. Kelly1, L. Thompson 1 Applied Physics Lab, University of Washington , Seattle, WA 2 School of Oceanography, U. Washington, Seattle, WA 15 years of surface currents shows that the North Atlantic Current is stronger when the subtropical gyre is weaker (and vice-versa)
Decadal Climate Predictability and Predictions – Focus on the Atlantic U.S. PI’s: T.L. Delworth, A.J. Rosati Geophysical Fluid Dynamics Laboratory/NOAA Princeton, NJ, USA Goal: Determine role of AMOC in producing observed climatic variability Difference in simulated summer rainfall when the AMOC is weak (cold North Atlantic) versus when it is strong (warm North Atlantic). Units are cm per day. Blue indicates less rain when AMOC is weak. Results from GFDL CM2.1 model.
Towards An Understanding Of The Role of The Atlantic Thermohaline and Wind-Driven Circulation In Tropical Atlantic Variability (TAV) U.S. PI’s: P. Chang1, R. Saravanan2 and R. Zhang3 Dept of Oceanography, Texas A&M University, College Station, TX Dept of Atmospheric Sciences, Texas A&M University, College Station, TX Geophysical Fluid Dynamics Laboratory, Princeton, NJ Fig. 1: Equatorial Atlantic ocean temperature change in response to North Atlantic fresh water input in GFDL CM2.1. Fig. 2: Simulated changes in monsoon rainfall over West Africa. (After Chang et al. 2008)
AMOC and the Working Group on Decadal Prediction • AMOC presentation to the WGDP in June • AMOC requests feedback from DPWG on distinguishing forced and natural components for AMOC • AMOC requests input on metrics for evaluating the AMOC in model simulations • Discussion of joint meeting on predictability with CLIVAR WGOMD September, 2010
Summary • U.S. effort is spinning up; some early tangible results • Continued partnership with international collaborators is essential to the community-wide goals of AMOC monitoring and prediction • Particularly: transatlantic measurements; the monitoring of subpolar North Atlantic and subtropical South Atlantic are key priorities. • Many shared interests among AMOC and USCLIVAR POS, WGDP, WGOMD. Need to exploit common interests