Download
1 / 9
120 likes | 528 Views
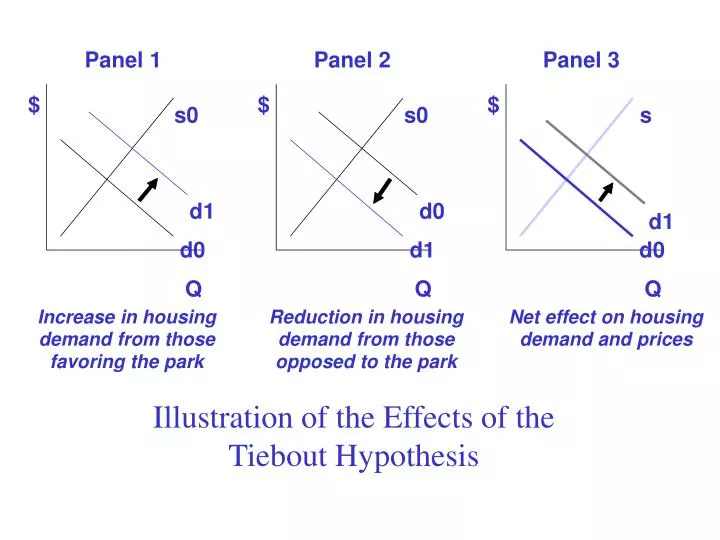
Panel 1. Panel 2. Panel 3. Illustration of the Effects of the Tiebout Hypothesis. $. $. $. s0. s0. s. d1. d0. d1. d0. d1. d0. Q. Q. Q. Increase in housing. Reduction in housing. Net effect on housing. demand from those. demand from those. demand and prices.

E N D
Panel 1 Panel 2 Panel 3 Illustration of the Effects of the Tiebout Hypothesis $ $ $ s0 s0 s d1 d0 d1 d0 d1 d0 Q Q Q Increase in housing Reduction in housing Net effect on housing demand from those demand from those demand and prices favoring the park opposed to the park
Illustration of the Gravity Model The shorter the distance between two objects, and the greater the mass of either (or both) objects, the greater the gravitational pull between the objects.
Illustration of the intervening opportunities model Chicago Little Rock
Polachek and Siebert’s (1993) Life-Cycle Migration Model Marginal cost and benefit A B Marginal cost Marginal benefit Age 0 t t 1 2 The individual moves as soon as the marginal benefit of moving exceeds the cost (at points A and B in the lifecycle)
Clark and Cosgrove's (1991) Wage Offer/Acceptance Functions wage W=wage acceptance W o F=wage offer from firm W 1 F W 1 2 W F 3 2 F 3 amenities
Graves and Clawson’s (1981) Equilibrium vs. Disequilibrium Views of Migration Perfect spatial information Imperfect spatial information and mobility world and mobility world Equilibrium Disequilibrium models models Amenity demand Job search emphasis emphasis Observed migration
Migration Dynamics in the Krugman Model (1993) q u . q=0 _ N s N s
Dynamics of the Graves and Mueser (1993) Model rent C(w,r,b)=C* U(w,r,a)=U* B r* A A B wage w*