1 / 11

Number of Students in each Mini School

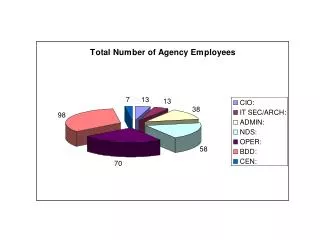
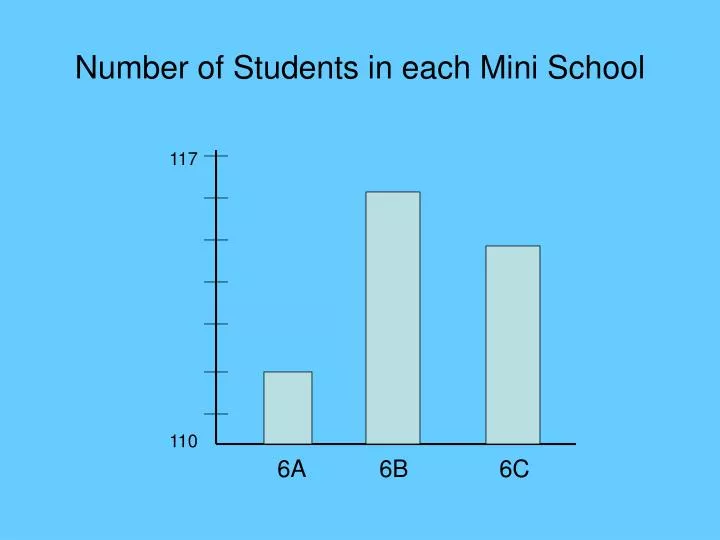
Number of Students in each Mini School. 117. 110. 6A. 6B. 6C. Number of Students in each Mini School. 120. Number of Students. 0. 6A. 6B. 6C. Mini School. MISLEADING GRAPHS. Essential Question: How do you identify features on a graph that may be misleading? SPI: 0606.5.2.

hina
Download Presentation

Number of Students in each Mini School

An Image/Link below is provided (as is) to download presentation Download Policy: Content on the Website is provided to you AS IS for your information and personal use and may not be sold / licensed / shared on other websites without getting consent from its author. Content is provided to you AS IS for your information and personal use only. Download presentation by click this link. While downloading, if for some reason you are not able to download a presentation, the publisher may have deleted the file from their server. During download, if you can't get a presentation, the file might be deleted by the publisher.

E N D

Presentation Transcript


  1. Number of Students in each Mini School 117 110 6A 6B 6C

  2. Number of Students in each Mini School 120 Number of Students 0 6A 6B 6C Mini School

  3. MISLEADING GRAPHS Essential Question: How do you identify features on a graph that may be misleading? SPI: 0606.5.2

  4. Reasons for Misleading…

  5. Y-Axis must start at 0 and have a steady interval.

  6. Why is this graph misleading?

  7. The same data: www.mediamatters.org/items/200503220005

  8. What is misleading about this graphs?

  9. Why is the graph misleading?

  10. The right way.

  11. Why is this graph misleading?

More Related