Download
1 / 15
150 likes | 158 Views
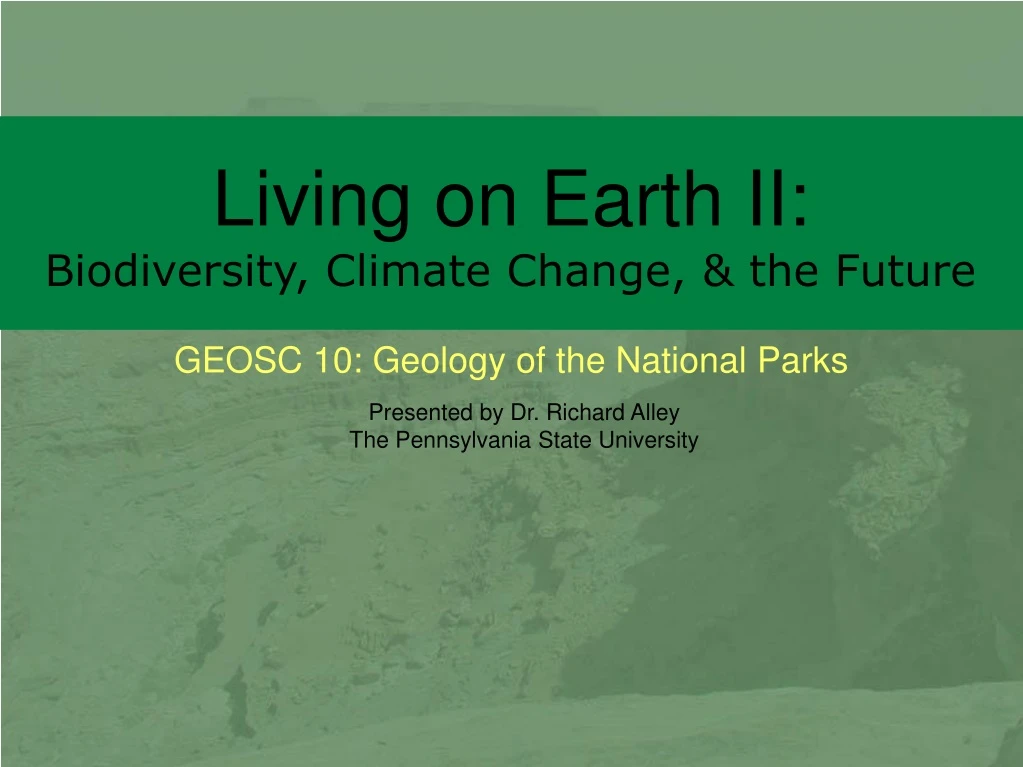
Living on Earth II: Biodiversity, Climate Change, & the Future. Presented by Dr. Richard Alley The Pennsylvania State University. Moose, Captain Cook State Recreation Area, Alaska.

E N D
Living on Earth II: Biodiversity, Climate Change, & the Future • Presented by Dr. Richard Alley • The Pennsylvania State University
Moose in town, Anchorage, Alaska. Humans and wildlife are interacting more and more, because we keep moving into their habitat.
Elk at Yellowstone National Park rest on the upper surface of Mammoth Hot Springs. The open setting discourages the bugs that torment the elk.
Caribou, south Greenland, doing the same thing as the elk in the previous picture—dodging bugs.
Not quite so large… a golden-mantled ground squirrel, Yoho National Park, Canada.
The Arctic National Wildlife Refuge (ANWR): Where Caribou Meet Oil Conduits (plus some coal pictures) ABOVE: USGS http://pubs.usgs.gov/fs/2003/fs014-03/pipeline.html RIGHT: Fish and Wildlife Service http://pubs.usgs.gov/fs/2003/fs014-03/pipeline.html
Photos from U.S. Fish and Wildlife Service; photo below hosted on web site of Vermont Senator Patrick Leahy http://leahy.senate.gov/issues/ environment/caribou.gif http://arctic.fws.gov/index.htm The Arctic National Wildlife Refuge (above) and its caribou (right).
Satellite image showing ANWR. To the north (top of picture) sea ice floats in the Beaufort Sea. Below, rivers drain from snow-covered mountains. http://www.nasa.gov/vision/earth/environment/frozen_north.html
http://geology.usgs.gov/connections/blm/energy/o&g_assess.htmhttp://geology.usgs.gov/connections/blm/energy/o&g_assess.htm Slightly fuzzy USGS map of oil (green), gas (red), and a lot of dry holes (gray) for the U.S. Alaska is reduced to fit; ANWR is at the far north (top) of Alaska.
http://www.ice.gov/graphics/news/insideice/images/oilwell_lg.jpghttp://www.ice.gov/graphics/news/insideice/images/oilwell_lg.jpg Modern Pennsylvania oil well. This happens to be a well that was seized by Immigration and Customs Enforcement (ICE) of the U.S. Government as part of investigation of drug crimes. http://www.eia.doe.gov/kids/history/people/pioneers.html Historical photo of the world’s first oil well, Drake Well Museum, Titusville, PA.
http://energy.er.usgs.gov/products/databases/USCoal/figure1.htmhttp://energy.er.usgs.gov/products/databases/USCoal/figure1.htm USGS map of coal resources in the contiguous U.S. The numbers and blue lines refer to different coal regions used in USGS studies. 1-3 on the far right are anthracite, 4-8 and 12-23 (shown in green and blue) are bituminous (of various grades; greener colors are closer to lignite, and the red bits in 4 and 7 are close to anthracite), and regions 9-11shown in yellow and orange are lignite.
Natural forcing explains temperature changes of a century ago but not recently; human forcing explains recent changes—Nature mattered, but now we control. Effects on temperature of changing sun & volcanoes Effects on temperature of changing greenhouse gases & acid rain Natural causes (more sun, fewer volcanoes) started warming (upper left) but switched to cooling; human causes (greenhouse gases, plus acid rain blocking sun) cooled in 1950s, now warming strongly (upper right and bottom). Each panel shows measured global-average temperature 1860-2000 (red line) and a model reconstruction with uncertainty (gray band). Effects on temperature of changing greenhouse gases, acid rain, sun & volcanoes UN IPCC, http://www.ipcc.ch
??? Scenarios show different possible futures, depending on how fast economy grows and how hard humans try to clean up CO2. Change to come. Change so far. Past change in CO2 is small compared to change coming, CO2 is still likely to be going up in 2100, and the world doesn’t end then (you may live past 2100…). (UN IPCC, http://www.ipcc.ch)
Past temperature change is small compared to expected change for all scenarios and climate models tested. Change so far is small enough that only those really paying attention have noticed; future change is expected to be much bigger. All projections show temperatures rising beyond the year 2100, which is not the end of time. Uncertainty arises both from not knowing what humans will do (different scenarios of human behavior are used, shown by different colors), and from not knowing exactly how nature will respond to humans (estimated by running each scenario through a range of computer models of the climate to produce the color-coded bars on the far right showing possible changes for that scenario). ??? Change to come. Change so far. YEAR UN IPCC, http://www.ipcc.ch