Download
1 / 18
180 likes | 278 Views
UltraPath in the Oligotrophic Ocean. Norm Nelson, UCSB Chantal Swan, UCSB / ETH with assistance of: Julia Gauglitz , Teresa Serrano Catala , Erica Aguilera. What we’ve done. AMMA 2006. P6 2010.

E N D
UltraPath in the Oligotrophic Ocean Norm Nelson, UCSBChantal Swan, UCSB / ETHwith assistance of: Julia Gauglitz, Teresa Serrano Catala, Erica Aguilera
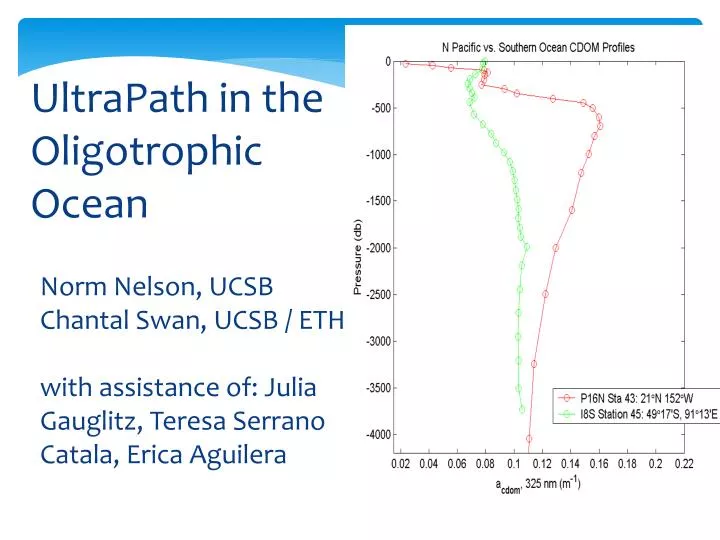
What we’ve done AMMA 2006 P6 2010 Global survey of CDOM in the surface and deep ocean piggybacking on the U.S. CO2/CLIVAR Repeat Hydrography Project Some experiments with characterization work
Advantages of UltraPath-like liquid waveguide spectrophotometer cells Long path enables measurement of absorption in the visible (>400 nm) waveband – important for NASA Ocean Color goals Small sample volume (UltraPath cell is ~12 mL) – important on hydrographic cruises with water budget issues Rapid analysis (our protocol is ~2 min/sample) – can analyze large number of samples (many stations, high depth resolution in profiles)
Disadvantages of UltraPath-like spectrophotometers Single beam systems (baseline drift)3 components (4-5 if you count the fibers) can be variable and can contribute to problems with analysis Refractive-index-difference throughput problem (driven by variable salinity and/or temperature, difference between sample and blank material)
Baseline Drift Correction Record baseline as optical density (with ultrapure water) every 10-15 samples (20-30 minutes) as well as before and after Track time of acquisition of each spectrum Use linear interpolation in time to find a baseline for each sample in session Replicate sample analysis suggests this works well
Refractive Index Variability It is convenient to use ultrapure water to monitor instrument stability and provide a ‘zero’ for uv-vis absorption spectrophotometry Pure water has a lower refractive index so “throughput” of liquid waveguide is lower, so calculated optical density (absorbance) is *negative* when CDOM absorption is low There is a spectral trend to this effect, so subtracting a long wavelength absorbance value (assuming zero CDOM absorption) is not sufficient. The apparent negative absorbance is relatively large compared to the open ocean CDOM absorbance so this effect may not be disregarded.
What we’ve done about it Initial efforts (2003) NaCl solution in water, estimating salinity from mass concentration – didn’t work very well, not sure how it related to practical salinity as measured by the ctd Artificial seawater (2004-2010) Prepared using combusted mineral salts (not all salts could be combusted) – extreme difficulty in repeating preparation and experiments – during this time we discovered that the UltraPath cell we had changed over time so earlier calibrations were incorrect and this needed to be repeated
What we’ve done about it (2) Dilution experiments – measure a full-concentration CDOM spectrum on a conventional spec (less affected by refractive index difference), prepare a dilution series to run on UltraPath, estimate salinity-dependent correction by subtracting the scaled conventional CDOM spectrum from the UltraPath spectra, use linear model computed for each wavelength to estimate correction based on practical salinity Refractive index estimation (based on Quan and Fry expressions) to test our assumption that the effect is due to refractive index alone – if so we can make solution-independent models based on refractive index , transferring the calibration from NaCl to natural seawater via the refractive index.
Problems with these approaches NaCl method – not sure if this accurately reflects refractive index behavior of seawater – relation to practical salinity? ASW method – very difficult to repeat, contamination a huge issue, still not sure of refractive index behavior Dilution method – reliant on a good CDOM spectrum from conventional spec – can’t do this with open ocean water, goes to zero at a short wavelength. Also differences from ocean to ocean (in progress)? Mineral salts (e.g. nitrate, absorption band at 300 nm, variable in the ocean) and contaminants in ‘pure’ NaCl Cells appear to change over time. Method must be easy to repeat and errors must be quantified
Examples NaCl ASW
Examples ASW Dilution
A Modest Proposal for refractive index correction in liquid waveguides Let’s use NaCl solutions. We can all obtain it, it’ll be roughly the same for everyone (modulo other salt contamination), we can presumably obtain the refractive index for any measurement based on temperature, concentration and wvln. Let’s use the refractive index as a ‘transfer function’ (with the Quan and Fry expression to estimate the refractive index of seawater) We need to record temperature of the solutions as well as everything else. Can we relate salinity to NaCl solutions? Is just the mass concentration (as ppt) close enough to practical salinity to be useful? Do we have to, if Quan and Fry is good enough?
Rough Outline for Correction Procedure Calibration with NaCl presumably gives us the baseline offset vs. refractive index linear relationship (for each wavelength) Temperature, practical salinity, and Quan and Fry expression gives us the refractive index of each sample and reference (for each wavelength) Compute the baseline offset for each wavelength based on the refractive index of the sample Apply to the waveguide spectrum.