Download
1 / 27
270 likes | 399 Views
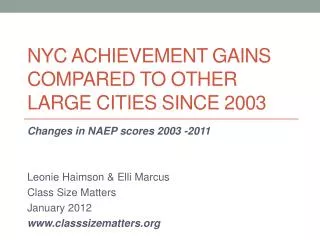
“Three Cities” within Toronto and TDSB Achievement Patterns. Robert S. Brown Research and Information Services/Organizational Development Toronto District School Board May 25 2010. “Three Cities” within Toronto and TDSB Achievement Patterns.

E N D
“Three Cities” within Toronto and TDSB Achievement Patterns Robert S. Brown Research and Information Services/Organizational Development Toronto District School Board May 25 2010
“Three Cities” within Toronto and TDSB Achievement Patterns • The Three Cities: What they are, geography, 1A/B, 3A-D, connection to LOI. • Achievement in 2008-9 according to City subgroups: Grade 3 EQAO Math, Grade 6 EQAO Math, Grade 9 cohort Science, Grade 9 cohort Program of Study, OSSLT, Post-secondary Confirmations • Geographical pattern of Grade 6 EQAO Math, 2008-9 • Summary
1. The Three Cities: • What they are, geography, 1A/B, 3A-D, connection to LOI
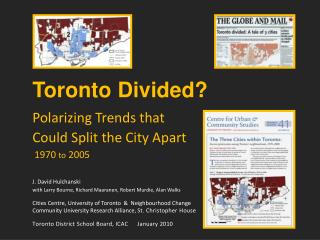
How are the 3 Cities Calculated? Change in Average Individual Income, City of Toronto, 1970 to 2000: • City 1 had an increase of 20% or more in average individual income, 1970- 2000. • City 2 had an increase or decrease of less than 20% • City 3 had a decrease of 20% or more.
City 1 – Two Categories • City #1-A are "elite" census tracts that have always been above average individual income and the income ratio has gone up 20% or more 1970-2005. • City #1-B are census tracts that were historically below average income and have gentrified, the income ratio has gone up 20% or more 1970-2005.
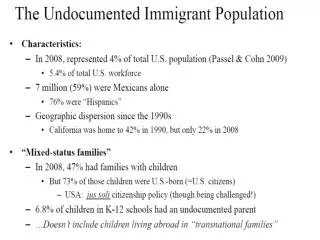
City 3: Four Categories • City #3-A =Youngest suburbs, more home owners, largest families, very high visible minority percentage particularly Chinese. • City #3-B =Older suburbs, more seniors, more White people than 3-A. • City #3-C =Renters in apartment towers, recent immigrant reception areas particularly South Asians. • City #3-D =Lowest incomes, higher Black population, most social housing, higher proportion of single parents.
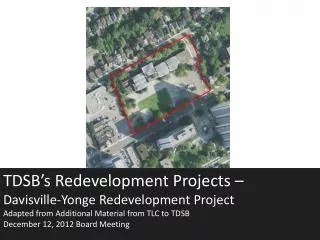
Why are 48 of 119 (40%) of the highest-needs elementary schools in the TDSB in either City 1 or 2? • School is just outside CT of high change (e.g. Parkdale, Queen Victoria, Regent Park). • Area was poor in 1970 and continued to be as poor in 2000. • Census Tract covers very diverse area (e.g. the CT in which Winchester is located, which is 1B). • With multiple boundaries, 6-8 or 7-8 students attend from outside CT (e.g. students from St. Jamestown CT attending Winchester in 7-8). • Average income is not as strong an indicator of student achievement compared to other variables. • Note that other schools (e.g. Market Lane) are not in 3 city list because of historical changes over time (development of harbour area).
1A 1B 2A 2B 2C 3A 3B 3C 3D City 3 City 1 City 2
1A 1B 2A 2B 2C 3A 3B 3C 3D City 3 City 1 City 2
1A 1B 2A 2B 2C 3A 3B 3C 3D City 3 City 1 City 2
1B 1A 2A 2B 2C 3A 3B 3C 3D City 3 City 1 City 2
1A 1B 2A 2B 2C 3A 3B 3C 3D City 3 City 1 City 2
Summary In general, highest achievement is seen in 1A, but 3A has very high achievement: • 1B has achievement sometimes higher, sometimes lower, sometimes the same as 3A, but always lower than 1A. • 3D has consistently the lowest achievement. • 2, and 3B-C have achievement patterns between 1A-3A and 3D.
Summary In general, highest achievement is seen in 1A, but 3A has very high achievement: • 1B has achievement sometimes higher, sometimes lower, sometimes the same as 3A, but always lower than 1A. • 3D has consistently the lowest achievement. • 2, and 3B-C have achievement patterns between 1A-3A and 3D.
Implications: • Average income is an important income variable but not the complete picture (median income, LICO/LIM, social assistance are others). • Income is an important factor of socio-economic status but is not the complete picture (education, parental status are other variables) See example of 3A. • Change over time is an important part of the picture but not the complete picture (see Guildwood as example of high income without high change, parts of south Toronto as examples of low income without change.
Implications (Continued) • Census tracts are an excellent way to show geographic patterns in Toronto (Three City Study, Priority Neighbourhoods) but in many cases the connections of schools to census tracts does not work (e.g. Queen Victoria). This is because 1) many students do not live in the CT of the school and 2) CT, like Toronto in general, often have huge within-geography ranges (e.g. extremely poor and extremely rich in the same CT). The Dissemination Area (DA) is much better at capturing these differences but too detailed for useful geographical patterns. • We should be very cautious in applying CT patterns to all schools (see the Priority Neighbourhoods as an example).
Implications (Continued) • The Three City evaluation shows great insight into many of the geographical patterns of TDSB achievement. In particular, the gap between the 'elite' areas of increasingly high income in 1A, and the low income areas of 3D, have profound implications. There have already been noticeable changes in a few areas between the census years 2001 and 2006 (e.g. the CT's drawing students to Thomas Wells and Brookbanks schools). • It would be important for an update of the Three City process with the 2011 Census, to show 40 rather than 30 years of change over time.
“Three Cities” within Toronto and TDSB Achievement Patterns Robert S. Brown Research and Information Services/Organizational Development Toronto District School Board May 25 2010 Thank You