Download
1 / 26
260 likes | 264 Views
Learn about quadratic functions, parabolas, vertex, axis of symmetry, graphing techniques, intercepts, maximum and minimum problems.

E N D
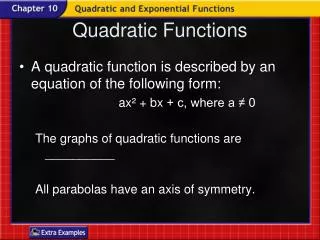
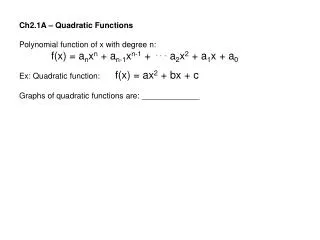
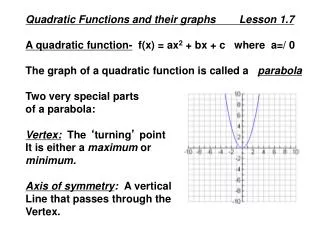
The Graph of f (x) = x2 • All quadratic functions have graphs similar to y = x2. Such curves are called parabolas: • It is a U-shaped curve with a unique special point, called vertex, which is the lowest or highest point on the graph • It is symmetric with respect to a vertical line known as the axis of symmetry.
The Graph of f (x) = ax2 For the graph of f (x) = ax2, the y-axis is the axis of symmetry. The point (0, 0) is the vertex of this parabola.
Example Graph: Solution (−2, 8) (2, 8) (−1, 2) (1, 2) (0,0)
Graph: Example Solution
6 5 4 3 2 1
Graphing f (x) = ax2 The graph of f (x) = ax2 is a parabola with x = 0 as its axis of symmetry. Its vertex is the origin. For a > 0, the parabola opens upward. For a < 0, the parabola opens downward. If |a| is greater than 1, the parabola is narrower than y = x2. If |a| is between 0 and 1, the parabola is wider than y = x2.
Example Graph: Solution vertex
Graphing f (x) = a(x – h)2 • The graph of f (x) = a(x – h)2 has the same shape • as the graph of y = ax2. • If h is positive, the graph of y = ax2 is shifted h • units to the right. • If h is negative, the graph of y = ax2 is shifted |h| units to the left.
The Graph of f (x) = a(x – h)2 + k Given a graph of f(x) = a(x – h)2, what happens if we add a constant k? Suppose that we add 2. This increases f (x) by 2, so the curve is moved up. If k is negative, the curve is moved down. The axis of symmetry for the parabola remains x = h, but the vertex will be at (h, k)
Graphing f (x) = a(x – h)2 + k • The graph of f (x) = a(x – h)2 + k has the same shape • as the graph of y = a(x – h)2. • If k is positive, the graph of y = a(x – h)2 is • shifted k units up. • If k is negative, the graph of y = a(x – h)2 is • shifted |k| units down. • The vertex is (h, k), and the axis of symmetry is x = h. • For a > 0, k is the minimum function value. For a < 0, the maximum function value is k.
Example Graph: and find the maximum function value. Solution Maximum = −1 vertex
Completing the Square By completing the square, we can rewrite any polynomial ax2 + bx + c in the form a(x – h)2 + k. Once that has been done, we will enable us to graph any quadratic function.
y 6 5 4 3 2 1 -5 -4 -3 -2 -1 1 2 3 4 5 -1 -2 x -3 -4 -5 Example Graph: Solution f(x) = x2 – 2x – 1 = (x2 – 2x ) – 1 = (x2 – 2x + 1) – 1 – 1 = (x – 1)2 – 2 The vertex is at (1, –2).
Complete Square Technique 1. Put parenthesis around non constant terms constant should be left outside of ( ). 2. Factor out leading coefficient a if a is not equal to 1. 3. Divide coefficient of x by 2 and square it. 4. Add this inside ( ) and subtract the same quantity outside ( ). 5. Write ( ) as a perfect square. 6. Simplify to put the function in standard form.
EXAMPLES Complete the square to put the function in standard form. Then determine the vertex and sketch its graph. 1. f(x) = x² - 8x +15 2. g(x) = 3x² - 18x + 110 3. h(x) = -x² -4x + 1
y 6 5 4 3 2 1 -5 -4 -3 -2 -1 1 2 3 4 5 -1 -2 x -3 -4 -5 Example Graph: Solution f (x) = –2x2 + 6x – 3 = –2(x2 – 3x ) – 3 = –2(x2 – 3x + 9/4) – 3+ 2(9/4) = –2(x – 3/2)2 + 3/2 The vertex is at (3/2, 3/2).
Finding Intercepts For any function f, the y-intercept occurs at f(0). Thus for f(x) = ax2 + bx + c, the y-intercept is simply (0, c). To find x-intercepts, we look for points where y = 0 or f(x) = 0. Thus, for f(x) = ax2 + bx + c, the x-intercepts occur at those x-values for which ax2 + bx + c = 0
y - intercept y 6 f (x) = ax2 + bx + c 5 4 3 x - intercepts 2 1 -5 -4 -3 -2 -1 1 2 3 4 5 -1 -2 x -3 -4 -5
Example Find the x- and y-intercepts of the graph of f(x) = 2x2 + 5x – 3. Solution The y-intercept is simply (0, –3). To find the x-intercepts, we solve the equation: 2x2 + 5x – 3 = 0.
The Vertex of a Parabola • The vertex of a parabola given by f (x) = ax2 + bx + c is • The x-coordinate of the vertex is –b/(2a). • The axis of symmetry is x = -b/(2a). • The second coordinate of the vertex is most commonly found by computing
Maximum and Minimum Problems We have seen that for any quadratic function f, the value of f (x) at the vertex is either a maximum or a minimum. Thus problems in which a quantity must be maximized or minimized can be solved by finding the coordinates of the vertex, assuming the problem can be modeled with a quadratic function.
Example • A model rocket is launched with an initial velocity of 1500ft/sec from a height of 40ft. The function s(t) = -16 t² + 150 t + 40 gives the height of the rocket t seconds after it has been launched. • Determine the time at which the rocket reaches its maximum height • Find the maximum height
l w w Existing fence Example A farmer has 200 ft of fence with which to form a rectangular pen on his farm. If an existing fence forms one side of the rectangle, what dimensions will maximize the size of the area? Solution • Familiarize. We make a drawing and label it, letting w = the width of the rectangle, in feet and l = the length of the rectangle, in feet.
Since the existing fence forms one length of the rectangle, the fence will comprise three sides. Thus 2w + l = 200. 2. Translate. The area is 3. Carryout. We need to express A as a function of ONE variable. To do so, we solve for l in the first equation to obtain l = 200 – 2w. Substituting for l in the second equation, we get A = (200 – 2w)w = 200w – 2w2
The area is maximum when it occurs at the vertex of the parabola. So, w = - b/2a = -100/-4 = 50 ft and l = 200 – 2(50) = 100 ft The maximum area is 5000 ft2 4. State. The dimensions for the largest rectangular area for the pen that can be enclosed is 50 ft by 100 ft.