Download
1 / 9
90 likes | 298 Views
EGF – Supplier report. Understand and Apply. Supplier Performance Evaluation. EGF Presentation EGF Composition Detailed Scoring Tables Supplier Scorecard FAQ. EGF (“ Évaluation Globale Fournisseur ”, comprehensive supplier evaluation).

E N D
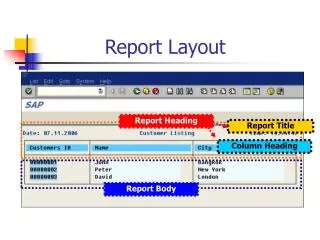
EGF – Supplier report Understand and Apply
Supplier Performance Evaluation • EGF Presentation • EGF Composition • Detailed Scoring Tables • Supplier Scorecard • FAQ
EGF (“Évaluation Globale Fournisseur”, comprehensive supplier evaluation) The EGF system is a monthly scoring system based on many delivery & quality factors. The lower the scoring, the better the performance. The upper acceptable limit is 100 points. Objectives • To allow Nova Bus to measure our suppliers and prioritize our actions. • To work with our suppliers with the aim of receiving better quality product and more precise deliveries. • To standardize our performance measures and eliminate subjective elements.
EGF Composition • EGF = QPM + DPM • QPM = Quality Performance Measure • PPM (parts per million) • Quantity of non-conforming parts • Quantity of MCN (Material Complaint Notices) • Monetary value ratio of non-conforming parts • DPM = Delivery Performance Measure • Quantity of faulty deliveries • Percentage of faulty deliveries • Quantity of late deliveries • The QPM and DPM are both based on a rolling 3-month horizon An action plan is requested when the EGF score exceeds 100 points.
Supplier Scorecard Objective • To inform suppliers rapidly and effectively of the evolution of their performance. Results • Highly visual scorecard with graphic elements • EGF results as well as 5 other important factors • More detailed data available on other sheets • Blue columns = Rolling data (cumulative EGF for the last 3 months) • Black columns = monthly data only
FAQ • What is the utility of this system? • How to read the Scoring Tables • How is the EGF calculated? • What is the difference between a faulty delivery and a late delivery? • How can we improve our score? • Who should we contact for more details regarding our EGF score? • How often is the EGF Scorecard issued? • Are previous results revised? • What should we do if we want to challenge a MCN?