Download
1 / 47
470 likes | 483 Views
17 th November 2015. Simple Energy Management through Utility Bills. How to help improve energy management without a dedicated energy manager. Welcome!. What does your energy bill tell you? How do you know it is right? How can bills be used to target & monitor change?.

E N D
17th November 2015 Simple Energy Management through Utility Bills How to help improve energy management without a dedicated energy manager
Welcome! • What does your energy bill tell you? • How do you know it is right? • How can bills be used to target & monitor change? A programme delivered by Zero Waste Scotland
What does you bill tell you? How much money your energy consumption is costing you: • Energy consumption • Tariff structure • Energy rates • Other charges
Electricity invoice New charges – 1 May to 31 May Sample
Terms on your electricity bill (A) • Kilowatt-hour (kWh). Unit of electric energy equal to 1 kW of power supplied from an electric circuit for one hour • Unit rate (p/kWh). Higher rates for on-peak (day and weekend) and lower rates for off-peak times (night) • HH metered supply. Meter electricity consumption data every half hour (HH) • Charges • Tariff structure – agreed variable and fixed charges • Variable charges – energy use, peak capacity, use of system, taxes • Fixed charges – connection
Terms on your electricity bill (B) Transmission Use of System (TUoS) • Charge for the cost of using the National Electricity Transmission System (NETS) that delivers electricity from power stations to regional transmission networks • Calculated based on site demand during peak periods called triads Distributed Use of System (DUoS) • Charge for using the regional transmission network between NETS and your building • Calculated based on volume of electricity consumed on site during times of peak demand, mid demand, and off-peak demand
Terms on your electricity bill (C) DUoS charges include: • Unit rates (p/kWh). 3 time periods: Red (peak), Amber (mid peak), and Green (off-peak) • Supply capacity charge. Based on “peak” energy use during a specific period. Charge is paid to the grid operator to have the capacity available to meet your peak demand, regardless of when it occurs • Supply capacity excess charge. If the agreed supply capacity is exceeded, a higher capacity charge is paid than the regular rate • Site charge. Fixed or standing charge due per day and per meter whether or not electricity is used on premises
Terms on your electricity bill (D) Reactive charge. Electrical systems use power to perform business or manufacturing processes • Some equipment has reactive power requirements • Inductive devices – motors, welding sets, induction heaters, fluorescent lights • Reactive power charges normally indicate poor Power Factor (PF) Power factor • PF proportion of current in an AC circuit used for its task • PF 0.8 means 80% of current is used effectively by equipment Settlement Charges • Fee for half hourly data service; HH data charges can also apply
Terms on your electricity bill (D) Climate change levy (CCL). Tax on the supply of energy products (electricity, gas, coal), set up to encourage energy efficiency improvements; currently set at 0.554 p/kWh for electricity and 0.193 p/kWh for gas – goes up in April each year
Gas invoice Bill period from 4 May to 1 June Sample
Terms on your gas bill (A) Kilowatt-hour (kWh). Unit of energy equal to 1 kW of energy supplied from gas mains network for one hour Reading this time, 149262 C. C is for meter reading supplied by customer, E is for estimate Correction factor. Factor to convert gas units into kilowatt hours (kWh). Standard across all suppliers (1.02264) Calorific value (CV). Amount of energy contained in gas, or heat generated when a known volume of gas is combusted (~39.4 MJ/m3)
Terms on your gas bill (B) Unrestricted units. Where there is an ‘unrestricted’ meter, there will be one single reading. Monthly charge. Fixed or standing charge due per day and per meter whether or not electricity or gas is used on premises Climate change levy (CCL). Tax on the supply of energy products (electricity, gas, coal), set up to encourage energy efficiency improvements
How do you know it is right? Actual or Estimated meter readings? Estimated meter readings are often higher than actual energy use. Every month, read your meters (electricity, gas, other energy, as well as water) and provide this information to your suppliers Check supply capacity excess. If your organisation exceeds the agreed peak capacity, the additional capacity will be charged at a higher rate. Update agreed capacity to peak capacity Check tariff. Check that your organisation is on the right tariff (electricity, gas) by checking online information from your supplier (or telephoning); compare rates with other buildings or suppliers to check costs are reasonable – base on all in rate
How do you know it is right? Check Climate change levy (CCL). Excluded or exempt from CCL? Exclusions: electricity & gas for domestic use or charities for non-business purposes Exemptions: supplies to good quality CHP schemes Check reactive power. Some distribution companies base their charge for reactive power on an assumed Power Factor. Find out if you can exchange your meter for one that measures reactive power if this is the case.
How is the bill calculated? • Billed units are calculated in kWh for the period of use for on-peak and off-peak times (day, night, weekend) • Multiply billed units by respective prices (i.e. £/kWh for period of use). Time periods and prices are stated in contract • Total consumption is sum of all billed units in the period of use • Multiply agreed peak capacity by agreed capacity rate (£/kVA) • Multiply excess peak capacity multiplied excess capacity rate (£/kVA) • Multiply reactive billed units by price (£/kvar) • Multiply billed number of units (kWh) by the CCL rate (£/kWh) • Add VAT at 20% unless exemptions apply • Sum to find total
Alternative tariffs • Single rate • Block rate • Off-peak • Time of use (part of DUoS structure) • Feed-in tariff Reduce your costs by selecting appropriate tariff • Under some tariffs, Use of System (UoS) rates change depending on time of day • UoS rates are generally lower between midnight and 7am
Electricity bills & the Future • Electricity Market Reform (EMR) • Electricity price increases are expected as a result of the EMR • Carbon Price Floor. Electricity generators are expected to have to pay more to meet the carbon price floor for emissions (perhaps paying £16/tCO2 ), and they are expected to pass this price on to consumers • Capacity Market. Electricity generators are expected to participate in a Capacity Market where they will receive a guaranteed price for electricity in exchange for guaranteeing a certain electricity capacity to the electricity grid. This may lead to higher costs for electricity customers
How can I use my bills to target and monitor change? • Understand your energy use – end-use breakdown • Identify where targeted improvements can be made across the estate • Benchmarking. Compare buildings using a league table to identify poorly performing buildings • Activity-based targeting. Calculate expected consumption with reference to things you can measure that make consumption vary. Sub-meter to measure energy consumption by end use • Monitor and measure impacts of changes in the future • Meter readings. Quantify impacts of changes • Share success. Share monitoring results of energy savings
Understand your energy use Energy consumption end-use breakdown Image source: Carbon Trust. Schools, Learning to improve energy efficiency. CTV019
Benchmarking Compare similar buildings Image source: Better Metering Toolkit. Better Building Partnership. London 2011
Estate league table Use benchmarking within the estate identify poorly performing buildings that can be improved, and also to identify buildings that are performing well that can be emulated Targets can be set and over – consumption league tables to prioritise investigations
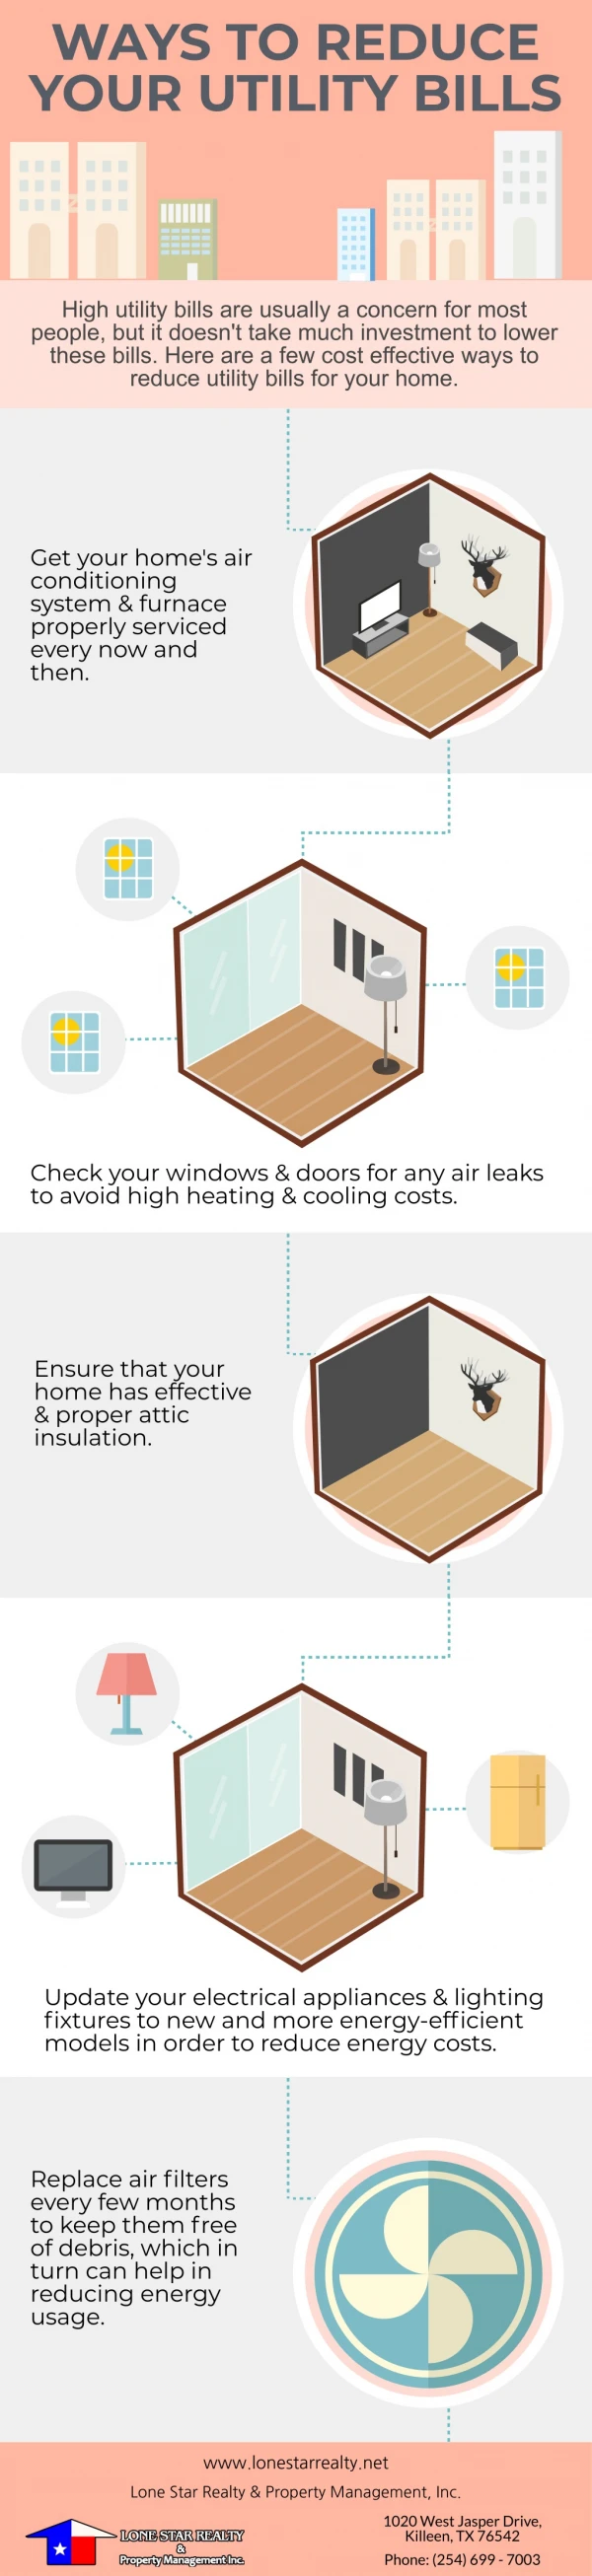
Opportunities for energy and cost saving • Switching off. Turn off energy consuming equipment when not in use. Can be switched off by building users, or timer switches, or building control systems • Maintenance. Routine maintenance procedures can improve energy efficiency • Identify simple changes to tariffs. Alternative tariffs • Power factor correction. Reduce reactive power used by equipment • Demand-side response. Run equipment at night for lower off-peak electricity rate • Refurbishment. Including energy saving measures in major refurbishments can be cost effective
Targeted improvements Activity-based targeting. Calculate expected consumption with reference to things you can measure that make consumption vary Table source: Monitoring and Targeting, Techniques to help organisations control and manage their energy use. Carbon Trust
Walk around checklist Identify energy saving opportunities in a walk-around Image source: Energy audit checklist. Resource Efficient Scotland http://www.resourceefficientscotland.com/resource/energy-audit-checklist
Monitor and measure Automatic meter readings Image source: Better Metering Toolkit. Better Building Partnership. London 2011
Monitor & measure 24-hour profile Image source: Monitoring and Targeting, Techniques to help organisations control and manage their energy use. Carbon Trust
Monitor & measure • Week profile • Sub-metering to show end-use Image source: Better Metering Toolkit. Better Building Partnership. London 2011
Monitor & measure • False-contour plot • Each horizontal column is one day (x-axis) • Each vertical column is one hour (y-axis) • Cells colour-coded for power level Image source: Monitoring and Targeting, Techniques to help organisations control and manage their energy use. Carbon Trust
Share success • Energy consumption • Before and after energy saving measures Image source: CMU energy savings over a year
Share success • Energy dashboard • Energy consumption by end use in buildings (e.g. plug loads) Image source: CMU energy savings over a year
For more information on our tools, guides and available support, please visit our website: www.resourceefficientscotland.com Alternatively, contact us by email: pssupport@resourceefficientscotland.com
Alternative tariffs • Single rate • Standard rates
Alternative tariffs Block rate Charges are based on a series of different kilowatt-hour rates applying to successive kilowatt-hour blocks of a given size during the period
Alternative tariffs • Off-peak (E7, Economy 7) • Electricity is charged at two rates • The day rate is higher • The night rate is less expensive • Often installed in properties that use electricity for heating and hot water
Alternative tariffs • Time of Use (ToU) • Part of DUoS structure • Different times of day incur different rates • Red – Peak • Amber – Mid-peak • Green – Off peak DUoS = Distributed Use of System
Alternative tariffs • Feed-in tariff • Payment made to organisation generating own electricity using renewables (e.g. PV)
Control • Consumption driven by weather • Relationship between fuel consumption and heating degree days Source: Monitoring and Targeting, Techniques to help organisations control and manage their energy use. Carbon Trust
Power factor correction • Power factor. Ratio of useful power to total power drawn from AC supply • Inductive devices use reactive power. Motors, welding sets, induction heaters, fluorescent lights. • Power Factor Correction (PFC) • Uses capacitors • Reduces power consumption • Leads to increased supply capacity • Increases life expectance of electrical equipment Image source: Power factor correction, An introduction to technology and techniques. Carbon Trust Image source: http://electrical-engineering-portal.com/beer-mug-and-power-factor
Voltage • Voltage. Average supply voltage in UK is 242V • May not match building equipment needs, causing electricity losses • Transformer tap settings • Check building equipment voltage requirements • Adjust voltage to match building requirements to reduce losses • Use settings on your existing transformer for voltage regulation • Distribution transformers have off-circuit selectors (“tap changers”) to allow for manual ratio adjustment of site Low Voltage (LV)
Demand-side response • Load shifting. Use off-peak electricity rates where possible by operating some equipment at night – e.g. charge electric vehicles at night • Thermal energy storage • Cooling. Building chillers operated at night to generate cold brine, or ice, which is stored in a central tank. During on-peak hours, chilled water circulated from storage system to supply building air conditioning system or supplement chilled water from a smaller chiller • Heating. Electric storage heaters (where gas heating is not available) • Distributed generation. Generate low-carbon electricity at the site – e.g. PV panels