Download
1 / 36
360 likes | 365 Views
This introductory training provides an overview of key labour market indicators in the Asia-Pacific region, focusing on concepts, methods, and interpretation. Participants will learn how to access online information resources for analysis of labour market information.

E N D
Labour market indicators in Asia-Pacific in the context of the Sustainable Development Goals: Concepts and methods Introductory Training for Analysis of Labour Market Information Makiko Matsumoto, Employment Specialist, ILO DWT-Bangkok Ulaanbaatar, Mongolia | 22 November 2016
Overview and objectives • Introduction: What do we want to know? • Key labour market indiactors and interpretation • Accessing online information resources
Introduction: What do we want to know? • Key labour market indicators and interpretations • Accessing online information resources
What do we want to know? • How is the labour market responding to economic conditions? • How is the labour market adjusting to demographic pressures? • What is the quantity of employment? • What is the quality of employment? • What kind of workers are in demand and what is the supply? • Are we making progress in the labour market? • What should be priorities for addressing labour market gaps
Sustainable Development Goal 8: Decent Work • Promote sustained, inclusive and sustainable economic growth, full and productive employment and decent work for all • Selected targets • 8.2: Achieve higher levels of economic productivity… including through a focus on high-value added and labour-intensive sectors • 8.3: Promote development-oriented policies that support productive activities, decent job creation… and encourage the formalization and growth of micro-, small- and medium-sized enterprises… • 8.5: By 2030, achieve full and productive employment and decent work for all women and men, including for young people and persons with disabilities, and equal pay for work of equal value • 8.6: By 2020, substantially reduce the proportion of youth not in employment, education or training
Sustainable Development Goal 8: Decent Work • Selected targets (cont.) • 8.7: Take immediate and effective measures to eradicate forced labour, end modern slavery and human trafficking and secure the prohibition and elimination of the worst forms of child labour… and by 2025 end child labour in all its forms • 8.8: Protect labour rights and promote safe and secure working environments for all workers, including migrant workers, in particular women migrants, and those in precarious employment • 8.9: By 2030, devise and implement policies to promote sustainable tourism that creates jobs and promotes local culture and products • 8.b: By 2020, develop and operationalize a global strategy for youth employment and implement the Global Jobs Pact of the International Labour Organization
Other related SDG and targets • Goal 1: End poverty in all its forms everywhere • 1.1: By 2030, eradicate extreme poverty for all people… • 1.3: Implement nationally appropriate social protection systems… • Goal 4: Ensure inclusive and equitable quality education and promote lifelong learning • 4.3: By 2030, ensure equal access… to affordable and quality technical, vocational and tertiary education • 4.4: By 2030, substantially increase the number of youth and adults who have relevant skills, including technical and vocational skills, for employment, decent jobs and entrepreneurship
Other related SDG and targets (cont.) • Goal 5: Achieve gender equality and empower all women and girls • 5.4: Recognize and value unpaid care and domestic work… • 5.5: Ensure women’s full and effective participation and equal opportunities for leadership at all levels of decision-making • Goal 10: Reduce inequality within and among countries • 10.1: By 2030, progressively achieve and sustain income growth of the bottom 40 per cent of the population at a rate higher than the national average • 10.4: Adopt policies, especially fiscal, wage and social protection policies, and progressively achieve greater equality
Introduction: What do we want to know? • Key labour market indicators and interpretations • Accessing online information resources
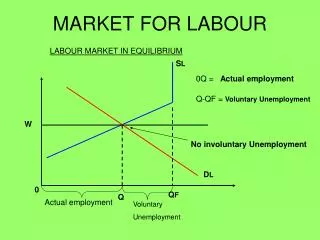
Key labour market indicators… • From the basic numbers, when it is disaggregated and monitored over time, a lot of insight on the dynamism of the labour market can be gained • Using standard survey-based data: • Demand is proxied by total employment • Supply is proxied by total labour force • The gap proxies lack of opportunities for those who want/need employment • How many (numbers) vs how ‘sufficient’ (indicators)
Key labour market indicators… • From the basic numbers, when it is disaggregated and monitored over time, a lot of insight on the dynamism of the labour market can be gained • Using standard survey-based data: • Demand is proxied by total employment • Supply is proxied by total labour force • The gap proxies lack of opportunities for those who want/need employment • How many (numbers) vs how ‘sufficient’ or ‘likely’ (indicators)
Key labour market numbers: Example • Labour force, employment and unemployment
Key labour market numbers: Example • Focusing on Q3 and disaggregating by age groups….
Key labour market numbers: Example • Labour force and employment had been increasing, but they gradually decline since 2012. • Much of the recent decline in the labour force and employment is driven by the situation of younger cohorts (particularly 15-24 year olds), while the number remained fairly steady for the middle-age group of 35-44, and increasing for the upper middle-age group of 45-54. • Disaggregating the numbers first by different population groups start to give hint on the movements in the aggregate numbers. • But should the observed trend be a concern for the policymakers, workers, employers?
Key labour market indicators: Example • Employment-to-population ratio and unemployment rate
Key labour market indicators: Example • Employment-to-population ratio and unemployment rate, by age groups
Key labour market indicators: Example • The general trend in the numbers (labour force, employment, unemployment) is confirmed by movement in the EPR (general increase, followed by a slight decline) and UER (decline followed by a slight increase). • The trend in numbers is mainly driven by demographics and changes in the cohort size – except for 15-24. • For young people, the rise in number of unemployed in recent years is also marked by a rise in unemployment rate – insufficient number of jobs for those who want/need a job. • Indicators ‘normalize’ the numbers in relation to the denominator chosen • For LFPR/EPR –the population movement • For UER – the size of the labour force
What determines if someone is employed? • Based on short reference period (usually past 7 days) • Above working age (usually 15+) • Defining features • Work: any activity performed to produce goods or provide services for use by others or for own use • Paid employment: performed some work for wage or salary in cash or in kind, or • Self-employed: performed some work for profit or family gain, in cash or in kind, or with an enterprise • Can be temporarily absent, but with formal attachment to job • Minimum criteria of 1 hour of work
Who are the unemployed? • Based on short reference period (usually past 7 days) • Above working age (usually 15+) • Defining features • Withoutwork • Availablefor paid employment or self-employment • Seeking work (registration at job fair, application to employer, sought family assistance, took measures to set up business)
What constitutes the labour force? • Based on short reference period (usually past 7 days) • Labour force • In working age population (15+) • Employed • Unemployed • Outside labour force • Population below working age • Population above working age, but not employed or unemployed • In school, retired, disability, discouraged, no need to work, others
Labour force participation rate • Definition: Sum of employed and unemployed as % of working-age population • Interpretation guidelines • Reflects supply of labour or those who want to be economically active • Signals magnitude of the employment challenge • Gender gaps can indicate labour market discrimination • No target level: Changes can reflect varied factors (e.g. schooling) • Short-term trends are relatively stable • Look at sub-groups (youth/adults, female/male, education level)
Employment-to-population ratio • Definition: Employment as % of working-age population • Interpretation guidelines • Reflects extent that economy generates work • Signals quantity (not quality) of employment • Gender gaps can indicate labour market discrimination • No target level: Changes can reflect varied factors (e.g. schooling) • Short-term trends are relatively stable • Look at sub-groups (youth/adults, female/male, urban/rural)
Unemployment rate (SDG) • Definition: Unemployed as % of labour force • Interpretation guidelines • Signals part of labour underutilization when unemployment is an option • Does not reflect the quality of employment • Shaped by economic structure/demand and the supply of labour • Progress measured by achieving acceptably low levels • Short-term trends can be relatively volatile • Look at sub-groups (youth/adults, female/male, education level)
Labour productivity growth (DWI/SDG8) • Definition: Annual(ized) growth of gross domestic product per employed person • Interpretation guidelines • Reflects the role of labour input in terms of GDP growth • Some growth rates capturing initial low base in the level of LP • Does not reflect contribution of other inputs (capital, technology, etc.) • Can signal the quality of employment at a macro-level • Higher LP associated with better earnings and working conditions • Shaped by economic structure (low LP in agriculture) • Look at economic sub-sectors (agriculture, industry, services) *100
Labour productivity growth (DWI/SDG8) • Example: Selected higher middle-income countries in AP – signs of slowdown
Employment by occupation • Definition: Employment as % distribution by main occupational groups • Interpretation guidelines • A rough proxy for skills required • High-skill (ISCO 1-3): managers, professionals and technicians • Medium-skill (ISCO 4-8): clerks, service and sales staff, skilled agriculture, craft and trades workers, machine operators • Low-skill (ISCO 9): elementary occupations • Can signal the quality of employment • Progress measured by increasing share of high-skill occupations • Shaped by economic structure (low-skill pervasive in subsistence agriculture) • Not good at capturing different skills requirement for medium-skill occupations • Disaggregation by sex can help assess occupational segregation
Employment by occupation: Example • The proxy matching of skills to occupation by education is clearer at the extreme, more difficult to interpret for the mid-levels
Employment by status • Definition: ICSE-93 (currently being revised) • Interpretation guidelines • Distinguishes paid employment vs self-employment • Captures the economic risks or the degree of autonomy that workers have with respect to explicit/implicit employment contract • 5 main groups: • Employees • Employers • Own-account workers • Members of producers’ cooperatives • Contributing family workers
What do wages include? • Total earnings (i.e. regular remuneration received from employers) in cash and in kind, including: • Direct wages and salaries for time worked (including overtime) or work done (including piece-rate and sales commissions) • Remuneration for time not worked (e.g. paid annual leave) • Bonuses and gratuities • Should be reported gross, not net: • Beforededuction of taxes and mandatory social security contributions • Exclude employers’ contributions to social security and pension schemes • Excludes severance and termination pay • Covers paid employees with employment relationship with an employer
Average nominal wages by occupation • Definition: Arithmetic mean of total monthly (hourly for SDG) earnings for employees for all jobs, disaggregated by 9 main occupational groups • Interpretation guidelines • Can signal the quality and conditions of employment • Higher wages associated with more productive and higher skilled jobs • Shaped by economic structure (low wages in agriculture) • Progress measured by achieving higher average real wages (applying consumer price index) • Look at disparities (female/male, industry, education)
Interpretation example: Thailand • Moderating economic growth and ageing demographics • Slowing economic demand and contracting labour supply • Unemployment remains low and generally unchanged • Vulnerable employment rising: Could indicate worsening job quality
Interpretation example: Philippines • Robust economic growth and youthful demographics • Accelerating economic demand and expanding labour supply • Unemployment remains high and generally unchanged • Vulnerable employment falling: Could indicate progress in job quality
Interpretation example: Viet Nam • Strong economic growth and transitioning demographics • Accelerating economic demand and expanding labour supply • Unemployment remains low and generally unchanged • Vulnerable employment rising: Could indicate worsening job quality
Introduction: What do we want to know? • Key labour market indicators and interpretations • Accessing online information resources
Further information resources • ILO: Decent Work Indicators for Asia and the Pacific (2008) http://www.ilo.org/asia/whatwedo/publications/WCMS_099163/lang--en/index.htm • ILO: Decent Work Indicators: Concepts and definitions (2012) http://www.ilo.org/integration/resources/pubs/WCMS_229374/lang--en/index.htm • ILO: Guide to the Millennium Development Goals Employment Indicators (2013) http://www.ilo.org/global/topics/post-2015/documents/WCMS_208796/lang--en/index.htm • ILO: Key Indicators of the Labour Market (2013) http://www.ilo.org/kilm • Resolutions of the 13th (1982) and 19th (2013) International Conference of Labour Statisticians (2013) http://www.ilo.org/global/statistics-and-databases/standards-and-guidelines/lang--en/index.htm
Thank you • Makiko Matsumoto • Employment Specialist • ILO Regional Office for Asia and the Pacific • matsumoto@ilo.org