Download
1 / 43
440 likes | 837 Views
Medical Imaging Analysis. Medical Imaging System. X-ray Computed Tomography (CT). Magnetic Resonance Imaging (MRI). Ultrasound. Nuclear Medicine Position Emission Tomography (PET). Characteristics of Diagnostic Ultrasound. Non-invasive. Safe (under regulations). Real-time.

E N D
Medical Imaging System X-ray Computed Tomography (CT) Magnetic Resonance Imaging (MRI) Ultrasound Nuclear Medicine Position Emission Tomography (PET)
Characteristics of Diagnostic Ultrasound Non-invasive. Safe (under regulations). Real-time. Reflection mode (similar to RADAR). Blood flow imaging. Portable. Body type dependent.
Clinical Applications OB/GYN, vascular, cardiac, transcranial, abdominal, musculoskeletal, endo-vaginal, endo-rectal, ocular, intra-vascular, …etc. (From www.acuson.com)
Ultrasonic Array Transducers (From www.acuson.com)
Delay Control Summation Weighting Beamformation Using Arrays • Focusing the ultrasound energy • Delay and weighted sum • Fixed focusing on transmit and dynamic focusing on receive • The beam quality is poor in the out of transmit focused region
f1 f2 f f3 Single zone focusing Multi-zone focusing Dynamic focusing Focusing
Resolution Point Spread Function (PSF) • Contrast Contrast to Noise Ratio (CNR)
Output Input LTI System 電路學 Impulse LTI circuit Impulse Response 影像 Point LTI System Point Spread Function Point Spread Function • 點的影像仍是點嗎? • Image of a point is point spread function (PSF). • 和電路學的 impulse response相同觀念。
2cm Frame rate 4cm speckle Dynamic range 6cm Single zone tx focusing Multi-zone tx focusing
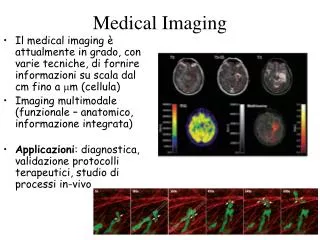
Speckle • Left: T甲狀腺,J為頸靜脈,C為頸動脈 • Right: RV右心室,LV左心室 T T C RV C RV LV LV J J
Speckle • granular noise • common in all phase sensitive imaging system Simulated US image Imaged object
Speckle Speckle • Speckle reduces the detect ability 3dB Simulated US image Imaged object
Speckle 6dB Simulated US image Imaged object
Speckle US sensor Phasor representation a1: amplitude 1: phase N: # of scatterers
PI I PE E Speckle • Assumption • ai: Gaussian distribution (central limit theorem, N ~10) • i: uniform distribution between and - (scatterers in the sample volume are randomly located) • I: intensity, exponential distribution • E: amplitude, Rayleigh distribution (Multiplicative noise)
Speckle • US image is usually displayed on log scale Taylor series expansion about I => (Additive noise)
CNR • Contrast to noise ratio (CNR) determines the contrast resolution of a image • Intensity can be viewed as signal and standard deviation can be viewed as noise I : intensity (mean2) s:standard deviation (std2)
Work • HW1 • Estimate PSF size, speckle std (dB, theoretical value ~ 4.34 dB), speckle histogram (back to linear) for both single zone tx focusing and multi-zone tx focusing and make a discussion about the results. • HW 2 • Repeat 1. under a different B-mode gain, and compare the results with those of 1. • HW 3 • Estimate CNRs in the focused region and in the out of focused region. • HW4 • Carotid color doppler and PW images of yours
2cm Frame rate 4cm speckle Dynamic range 6cm Single zone tx focusing Multi-zone tx focusing Work – HW1 (gray to dB) Speckle histogram (gray to dB, and then dB back to linear) and std (gray to dB)
Work – HW2 Higher B-mode gain Lower B-mode gain
Work – HW4 • Carotid Color Doppler
Work – HW4 • Carotid PW
pulser receive signal processing T/R switch display transducer A-mode & B-mode • A-scan, one-dimensional received signal • B-scan, two-dimensional
red bright multiple gates multiple firings zero velocity, black dark bright blue Color Flow Doppler (CFD) • The ultrasonic data acquisition process in Color Doppler is similar to that in B-mode except that the ultrasonic pulse needs to be fired multiple times along the same direction sequentially before moving to the next beam. positive velocity negative velocity
Pulse Wave Doppler (PWD) Doppler Signals PRI Vessel Wall Depth (Fast Time Index) Vessel Wall 1 2 3 4 5 6 7 Firing Number (Slow Time Index)
超音波影像擷取架構圖 GE Medical System LOGIQ 500 MD Frame Grabber (UPG401B, UPMOST Corp.) Transducer 仿體
仿體 (Phantom) . . . . . . . . . . . . . . . Model: Grey Scale Phantom RMI 403GS LE http://www.gammex.com/403GSLE.htm Horizontal Spacing . . . . . . . . . . . 2 4 6 8 10 12 14 16 3 cm Axial Resolution Vertical Spacing Gray Scale Target 18 cm 2 1 3 4 Axial Resolution . . . . Axial Resolution 16.5 cm
醫用超音波儀器(1) ON/OFF Linear Array 仿體 GE Medical System LOGIQ 500 MD
醫用超音波儀器(2) 面版說明 B-mode Gain Doppler Mode Depth
醫用超音波儀器(3) 影像輸出 Image Output Frame Grabber (UPG401B, UPMOST Corp.)
影像擷取程式(1) 執行UPMOST程式
影像擷取程式(2) 執行Capture選項 執行File選項 選項: 1. Save Single Frame 2. Save Captured Video As 選項: 1.Single Frame 2.Video
超音波影像LOAD到MATLAB (副檔名) RAW_Image = imread(‘檔名’,’.bmp’); Gray_Image = rgb2gray(RAW_Image) ; % Convert to GRAYSCALE DoubleImage = double(Gray_Image) / 255 ; % Convert to DOUBLE format