Download
1 / 27
300 likes | 492 Views
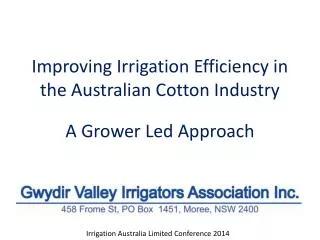
Benchmarking Irrigation Water Use for the Australian Cotton Industry. Janelle Montgomery, Robert Hoogers Kieran Shepherd & Stuart Bray. Irrigation Australia Ltd Conference, June 2 – 6, June 2014. How is the Australian Cotton Industry Performing? Bales/ML. Background

E N D
Benchmarking Irrigation Water Use for the Australian Cotton Industry Janelle Montgomery, Robert Hoogers Kieran Shepherd & Stuart Bray Irrigation Australia Ltd Conference, June 2 – 6, June 2014
How is the Australian Cotton Industry Performing? Bales/ML • Background • Cotton industry continues to be criticised for its water use • Australian cotton industry proactive in assessing WUE • Benefits of benchmarking • Industry - show rate of improvement, MERI • Individual irrigators - compare performance with region or industry enabling improvement.
Surveys of Cotton Water Use • Cameron and Hearn (1997) Agronomic and economic aspects of water use efficiency in the Australian cotton industry. Report to CRDC, unpublished. • Irrigation efficiency (% water input used in ETc) • Crop Water Use Index (Yield / ETc)
Surveys of Cotton Water Use • Tennakoon and Milroy (2003) Crop water use and water use efficiency on irrigated cotton farms in Australia, Agricultural Water Management, Vol. 61, pp 179-194 • 1996/97, 1997/98 & 1998/99 cotton seasons • 25 farms • Gross Production Water Use Index 0.79 Bales/ML • Best data available • Subtle differences in definitions and methodology
“lack of good annual and robust benchmarking data is an issue that the cotton industry and irrigation sector needs to address”Payero and Harris (2007) • Payero, J. And Harris, G. (2007) Benchmarking Water Management in the Australian Cotton Industry. Cotton Catchment Communities CRC, QDPI&F
NSW DPI have rectified the lack of robust irrigation benchmarking data • Irrigation benchmarking studies carried out by NSW DPI • 2006/07 cotton season (138,795 ha) • 2008/09 cotton season (140,590 ha) • 2012/13 cotton season (405,000 ha) • 06/07 & 08/09 low price, low water availability meant small plantings. • 2012/13 good water and record plantings.
A survey of Cotton Water Use • ~ 40 farms visited from Central Qld to Southern NSW • 06/07 • 36 farms • Grew 12,000 Ha of cotton – 9% of 2006/07 area • Yielded 109,000 bales – 13% of 2006/07 yield • Estimated 99,000 ML of irrigation water used • 08/09 • 45 farms • Grew 17,000 Ha of cotton – 12% of 2008/09 area • Yielded 106,000 bales – 7% of 2008/09 yield • Estimated 96,000 ML of irrigation water used • 12/13 (preliminary results) • 40 farms to date (6 still to collate) • Grew 22,000 Ha of cotton – 5% of 2011/12 area • Yielded 207,807 bales – 5% of 2011/12 yield • Estimated 166,601 ML of irrigation water used
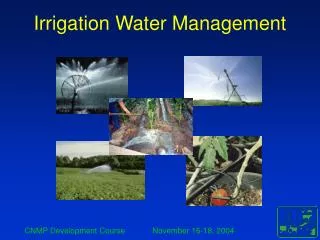
Data collection and analysis • Utilised on-line calculator Watertrack Rapid • Ensures consistency overtime • Robust calculations of: • irrigation performance indicators • crop water use • effective rainfall • on-farm water losses • Watertrack Rapid used for all NSW DPI surveys
A Survey of Cotton Water Use for the 2006/07 season • Data collected on-farm includes: • Yield, area, soil type, • Sowing/harvest dates • Irrigation dates • Water Inputs – rainfall, storage volumes, water harvested, starting and ending soil moisture deficit
Comparison of irrigation benchmarks • 40 per cent increase in Gross Production Water Use Index (bales per ML) in 10 years • Tennakoon and Milroy (2003) • Cotton Industry Average GPWUI = 0.79 b/ML • 2006/07 Watertrack Rapid Survey • Cotton Industry Average GPWUI = 1.13 b/ML
12/13 Preliminary Results - Water Summary Reports
12/13 Preliminary Results – Performance Indicators
Yield and water comparisons – Lowest 10 whole farm yields 28% 18% 50% Total Water Loss (ML/ha)
Performance indicator comparisons – Highest 10 whole farm yields
Performance indicator comparisons – Lowest 10 whole farm yields Industry Av. 1.27 b/ML
Conclusions Valuable information that is consistent and defined Australian Cotton Industry can confidently state that they have had a 40% increase in GPWUI over 10 years. 2012/13 preliminary results show that the cotton industry is performing just as well in years of full production, when they are managing much larger volumes of water. Variation in the GPWUI between individual farms suggests there is still room for improvement A significant effort by the industry is needed to collect and report irrigation performance indicators This will better inform policy makers and the general public of the best practice performance of which the cotton industry is capable.
Acknowledgements • I acknowledge the cooperation and assistance provided by the irrigators, consultants and QLD and NSW Irrigation and Cotton extension staff and funding by CRDC. THANK YOU