Download
1 / 16
160 likes | 323 Views
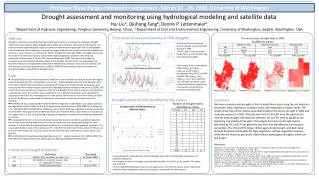
Monitoring and Modeling Land-Use Change in the Pearl River Delta, China, Using Satellite Imagery and Socioeconomic Data. Robert K. Kaufmann Harvard University January 29, 2003. http://www.bu.edu/cees/readmoreRK.html.

E N D
Monitoring and Modeling Land-Use Change in the Pearl River Delta, China, Using Satellite Imagery and Socioeconomic Data Robert K. Kaufmann Harvard University January 29, 2003 http://www.bu.edu/cees/readmoreRK.html
Modeling and Forecasting Effects of Land-Use Change in China Based on Socioeconomic Drivers Boston University Department of Geography Principal Investigator: Robert K. Kaufmann Co-Investigators: Curtis E. Woodcock Dennis G. Dye Karen C. Seto Chinese Collaborators: Lu Jinfa, Institute of Geography CAS Li Xiaowen, IRSA Wang Tongsan, Economic Forecasting Center Huang Xiuhua, IRSA Liang Youcai, State Information Center Funded by NASA LCLUC-NAG5-6214
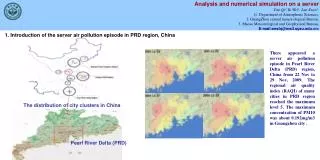
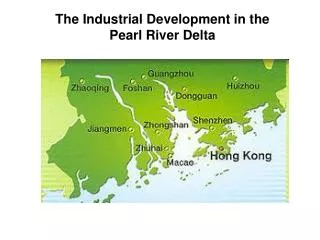
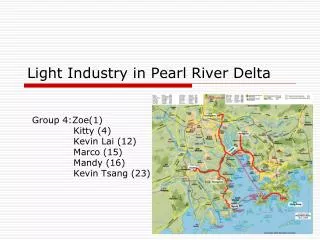
Why Pearl River Delta, Guangdong Province? • 1988 - 1996 real GDP growth: 350-550% • Major agricultural region and national leader in production of: lychees, bananas, pond fish, sugar cane • Special Economic Zones • Geographic proximity to Hong Kong • Cultural ties to overseas Chinese investors
China Study Area: Pearl River Delta
30 December 1995 TM 432 3 1 2
3 March 1996 TM 432 10 December 1988 TM 432 Land-Use Change Map water natural vegetation agriculture urban natural to urban agriculture to urban 5 km
10 December 1988 TM 432 3 March 1996 TM 432 Land-Use Change Map water agriculture water to ag ag to urban 5 km urban natural vegetation natural to urban
10 December 1988 TM 432 3 March 1996 TM 432 Land-Use Change Map water natural vegetation agriculture urban agriculture to water natural to urban agriculture to urban 5 km
Official Estimates vs. Satellite-Derived Estimatesof Agricultural Land Seto, K.C., R.K. Kaufmann, and C.E. Woodcock. 2000. Agricultural land conversion in southern China. Nature 406: 121.
Land Use and Land Use Change:1988 -1996 Made in conjunction with NASA Goddard Space Flight Center
350 - 550% 200 - 300% 100 - 190% 1988 - 1996 Real GDP Growth 25 km
1988 - 1996 Percent Land-Use Change of Counties High: 17 - 23% Medium: 14 - 15% Low: 0 - 9% 25 km
Modeling Socioeconomic Drivers of LUC Yit = ai + bixit + mit i = 1,…, N t = 1,…, T • Dependent variables: - agricultureurban - natural vegetation/waterurban • Examples of independent variables: - GDP - Demography (m/f/rural/urban) - Gross output value in industry & agriculture - Wages by sector
Drivers of Land-Use Change Agriculture to Urban = -0.11 [-5.0] + 1.50 *Relative land productivity [1.97] - 3.97 *Ag labor productivity [-4.58] + 1.24 *Investment in capital construction [2.74] + 0.03 *Average wage [5.98] Natural to Urban = 0.028[3.13] + 6.53*Relative land productivity [3.55] - 1.39 *Relative labor productivity [-3.37] + 2.85*Investment in capital construction [3.27] Seto, K.C. and R.K. Kaufmann, In press, Modeling the drivers of urban land-use change in the Pearl River Delta, China: Integrating remote sensing with socioeconomic data. Land Economics
Evaluation of Results * Panel cointegration--variables share the stochastic trend * Hendry forecast test--Regression results stable over space and time * Moran’s I--No spatial autocorrelation * Granger causality--Some evidence that RHS variables “Granger cause” land use change no evidence for opposite effect
Results • Successful mapping of land-use change with high accuracy (93.5%) • Amount of developed land has increase by 319% between 1988 and 1996 • Developed new method to evaluate change in series of images using time series techniques • Identified and quantified major drivers of urbanization