Download
1 / 19
190 likes | 200 Views
Agricultural Monitoring by Professor R. Tsheko, Agriculture Service Capacity Building Partner - BUAN. 14-17 March 2016, Windhoek, NAMIBIA. Talking Points. Status Priority areas of action (agriculture) Agricultural Information System Agricultural Data Collection systems

E N D
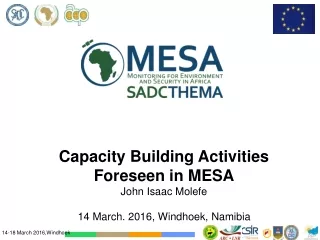
Agricultural Monitoring by Professor R. Tsheko, Agriculture Service Capacity Building Partner - BUAN 14-17 March 2016, Windhoek, NAMIBIA
Talking Points • Status • Priority areas of action (agriculture) • Agricultural Information System • Agricultural Data Collection systems • Parameters for Monitoring Agriculture • Crop & Rangelands Monitoring • Sensors – NDVI, Rainfall, Temperature • Models • Data requirements for Agricultural Monitoring • Role of SADC Training Institutions
Status • AU declared 2014 as their Year of Agriculture and Food Security • 2014 was the 10th anniversary of Comprehensive Africa Agriculture Programme (CAADP) • 2014 was declared International Year of Family Farming by the 66th UN General Assembly • GDP grew from 2.1% (1990-1999) to 4.8% (2000-2010) • Agricultural sector GDP grew from 3.0% (1990-99) to 3.2% (2000-10) • Poverty rates declined from 56% to 49% in the same period • Over 200million Africans are living in extreme poverty • Ref: FAO Regional Conference for Africa (2014)
Priority areas of action • Provide enabling environment for investment by domestic private sector • Investing in a home grown science, technology and learning agenda that is responsive to the needs and goals of farmers (especially smallholder farmer and family farmer) • Building systemic capacity for results-oriented action and implementation • Ref: FAO Regional Conference for Africa (2014)
Introduction to RS • About 70% of the Earth’s land surface is covered with vegetation (water covers 71% of the Earth’s surface). • Remote sensing is used for resources management and monitoring in agriculture, forestry, rangelands, wetlands and urban vegetation.
Agricultural Information System What is an effective agricultural information System? • Provides policy makers and programme development officials with reliable and up to date information for • Policy development • Emergency preparedness • Planning and decision making This calls for regular collection of data (the data is also used for monitoring progress) The information derived from the collected data has to be disseminated to beneficiaries
Data collection system What is an effective agricultural data collection system • Traditional manual data collection • Automatic remote sensing system • A hybrid of the two? What are the issues to consider in data collection and information dissemination? • Timeliness • Accuracy (usefulness) • Cost • Easily understood by the policy maker, extension staff and farmer (especially smallholder and family farmer)
Monitoring parameters • Agricultural vegetation develops from sowing to harvest as a function of meteorological driving variables (e.g. temperature, sunlight, and precipitation). • The growth is further modified by soil characteristics, plant material (genetics), crop management etc. • Changes in crop vigour, density, health and productivity affect canopy optical properties, crop characteristics have been monitored by the use of land based, airborne and satellite based imaging systems.
Rangelands monitoring • Since the beginning of range science, evaluation and monitoring of landscapes have relied on judgment and experience which is more art than science. • There has been increasing pressure to objectively monitor rangelands and remote sensing and GIS have been found to be the tools to achieve this objective. • Cover measurement by image analysis appears faster and more objective than standard point-sampling methods, though validation or ground truthing still remains a very important exercise
Satellite Rs • Satellite images can play a role in: • providing direct information about crop stage, crop conditions and crop yield by observing the spectral properties of green vegetation; • providing estimates of the meteorological variables that drive crop development such as temperatures and rainfall; (instead of GSOD!) • Providing extensive, unbiased, economical sampling; and, vegetation cover measurements and hence reduce or avoid the human-judgment factor. • Acquiring appropriately distributed information over large areas in short time periods and on random sites far removed from easy ground access.
Spectral Information The relationship between the spectral properties of crops and their biomass/yield was recognized since the very first spectrometric field experiments. The use of spectral data was studied extensively by using satellite imagery after the launch of the first civil Earth observation satellite (Landsat1) in 1972….now we are at Landsat8 But it is only with the growing availability of low resolution satellite images from the meteorological satellite series NOAA (National Oceanic and Atmospheric Administration) AVHRR (Advanced Very High Resolution Radiometer) in the early 80’s, that similar analyses were extended to large areas, including many countries in arid and semiarid climates
Satellite RS These images were typically available at the national and multinational level with a 1km resolution (LAC) and at the continental and global level with a 4.6 km resolution (GAC) or below. In the 90’s the French-Belgian-Swedish satellite SPOT was launched equipped with a 1km resolution sensor for vegetation monitoring at global scale called VEGETATION
Disadvantages of sensors The intrinsic drawback of these sensors is related to their low spatial resolution, with pixel sizes of about 1 km², i.e. far above typical field sizes. As a consequence, recorded spectral radiances are mostly mixed information from several surface types. This seriously complicates the interpretation (and validation) of the signal as well as the reliability of the derived information products. However, for crop monitoring, early warning and yield forecasting at the national or regional scale a 1 km² resolution is quite suitable. High resolution data is available (at huge cost) if one is interested at performing field size analysis especially for large scale commercial farming.
Sensors Meteorological variables such as rainfall and temperatures can also be derived from satellite and are most commonly provided by geostationary satellites such as METEOSAT. Data are measured directly by the satellite such as land and sea surface temperatures (as thermal radiation), while others, such as rainfall, have to be modelled based for example on cloud temperatures or other factors. As an alternative, meteorological data can also be modelled by the so called atmospheric circulation models that divide the atmosphere in vertical cells and model atmospheric changes between cells at a given time step (e.g. 6 hours).
Models At every model run, the models are re-initialized with measured data from meteo stations, weather buoys, airplanes and satellites. Such models are most commonly used for weather forecasts, but can also be used for estimating meteorological data over large areas.
Data requirements In order to be used for crop and rangeland monitoring the above mentioned information must have the following characteristics: Near real time availability (2-3 days after the period of observation) Relatively high temporal frequency (usually 10 days) Fixed geographic window of observation (you will appreciate these in the e-station)
Role of SADC Training Institutions • Introduce EO (RS & GIS) in Universities (revise existing curriculum?) • Introduce the monitoring of Agriculture & Natural Resources using EO (curriculum development?) • In service training of (public service + private sector+ civil society) ==Operational monitoring service • Validation of agricultural service products (and agricultural service) • Research (Bsc, Msc, phDetc) • AMESD, MESA, GMES …. • Data is available • Training materials available • Software tools (open ware) available
THANK YOU This presentation has been prepared with the financial assistance of the European Union. The contents are the sole responsibility of MESA SADC THEMA and can under no circumstance be regarded as reflecting the position of the European Union