Download
1 / 40
400 likes | 406 Views
Climate Change: Laying out the Problem Science Cafe. Richard B. Rood 734-647-3530 rbrood@umich.edu January 24, 2007. Some Climate News. National Oceanographic and Atmospheric Administration (NOAA) // World Data Center for Meteorology // National Climatic Data Center

E N D
Climate Change: Laying out the ProblemScience Cafe Richard B. Rood 734-647-3530 rbrood@umich.edu January 24, 2007
Some Climate News • National Oceanographic and Atmospheric Administration (NOAA) // World Data Center for Meteorology // National Climatic Data Center • http://www.ncdc.noaa.gov/oa/wmo/wdcamet.html • State of the Climate • http://www.ncdc.noaa.gov/oa/climate/research/monitoring.html#state
What is Science? • When used in the application of the scientific method • Hypothesis is a proposition that can be tested whether or not it is valid. Formally, by experiment, often by ability to predict. • Theory is systematically organized knowledge based on tested hypotheses and principles. • Principles are basic truths from which hypotheses are drawn and on which theories are built. • Facts are information that is objectively real or true.
Attributes of Science-based Knowledge • An important attribute of knowledge derived scientifically is that it is based in observation and tested. There is also independent testing by others (like an audit). Further, new tests are posed to challenge theories, which lead to refinement and strengthening of the theory. Sometimes the theories are proven wrong – at least in part.
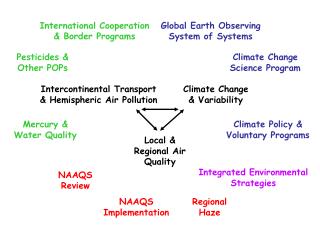
Temperature Water Precipitation Evaporation Humidity Air Composition Air quality Aerosols Carbon dioxide Winds Clouds / Sunlight Droughts Floods Extreme Weather What parameters/events do we care about?
Note: There is consistency from many models, many scenarios, that there will be warming. (1.5 – 5.5 C) Also, it’s still going up in 2100! Basic physics of temperature increase is very simple, non-controversial. The prediction: *
Projected Global Temperature Trends 2071-2100 temperatures relative to 1961-1990. Special Report on Emissions Scenarios Storyline B2 (middle of the road warming). IPCC ‘01
Uncertainty • If you were to assign uncertainty • Regional, seasonal predictions are more uncertain than latitudinal, annual predictions are more uncertain than global, time-average prediction.
Systematic Temperature Changes • Global Temperature increase 1.5 – 4.5 C • Poles warm faster than globe, especially the North Pole. • Land warms faster than ocean. • Night warms faster than day • Spring starts earlier • Autumn starts later
Update: Troposphere warming is observed. Correction of satellite temperature Update: 2000s have continued trend
Water • Water vapor in atmosphere will increase (It’s a greenhouse gas.) • Precipitation will increase • Evaporation will increase (It’s warmer.) • Snow cover will be less over most continents. • Snow could increase in Greenland and Antarctica?
Storms, Drought, Floods • Extreme events are expected to occur more often and to be more extreme.
Update: Papers in 2006 that ice is melting more rapidly Update: Papers in 2005 that hurricane intensity has increased
Sea level predictions • 0.11 to 0.43 meters due to thermal expansion, warming of the ocean water • 0.01 to 0.23 meters due to melting of continental glaciers • Greenland: -0.02 + 0.09 meters ??? • Antarctica: -0.17 + 0.02 meters ??? • These are likely to change appreciably with the new IPCC. Comes out in February.
Freeze-free periods are getting longer Snow cover decreasing Growing season longer Spring is earlier CO2 annual cycle is getting larger Sea ice is decreasing Mountain glaciers are decreasing Mountain ecosystems are changing … Systematic Look
Regional issues identified in assessments • Reduction in water level of the Great Lakes (1-5 feet) • Temperature rise (20th Century and predicted) • Precipitation increase (20th Century and predicted) • Human health in cities • Heat waves / Reduced extreme cold • Air quality worse in heat • Agriculture and forestry • Soil moisture decrease, more drought • Growing season longer • Changes in insects, disease, fire … • Ecosystem – water and air quality • Lower stream flows, punctuated with floods • Changes in flora and fauna (land and water) due to temperature • Invasive species • External factors from other regions • Water for western half of U.S. • Great Recycling and Northern Development Canal (James Bay in Canada) • Water for eastern half of the U.S. • Hydroelectric facilities • Pollution from/to other regions Ice reduced, shoreline damage decreased, less snow removal, more land, …
What do with do with this information? • Is this information about probable climate change accurate and interpretable? • Is it robust? • How often and fast does it change? • Is it consequential? • Are there risks if we ignore it? • Are there risks if we believe it? • How does this information about probable climate change relate to humans and the things that humans do?
How do we get our information? • Direct research, generation of new knowledge • Review of the primary source literature • Journalism • Editorials • Entertainment • Public Outreach from Information Holders • Popular literature • Texts, formal education • Peer-reviewed evaluations of the state of the knowledge of the field
How do we evaluate this knowledge? • How do we evaluate (validate?) this information? • Personal experience • Is it hotter where I live? • Relative to what we know and believe • How does it impact us? Does it cost something? • In some absolute sense? • Look at past observations • Look at ability to predict • Look at quality of observations • Look at consistency of theory, robustness of hypothesis • Attribution of change, cause and effect This is where we will spend most of the first group of lectures
Belief System Values Perception Cultural Mandate Societal Needs What are the pieces which we must consider?(what are the consequences) Security Food Environmental National ...???... Societal Success Standard of Living POLICY ECONOMICS ENERGY RELIGION ?????? SOCIAL JUSTICE “BUSINESS” PUBLIC HEALTH information flow: research, journals, press, opinion, … SCIENTIFIC INVESTIGATION OF CLIMATE CHANGE
Energy • The climate change problem and energy policy are correlated, currently, they are completely intertwined. • By most standards, energy use is directly related to societal success. • Hence virtually all elements of society are stakeholders.
World primary energy supply in 1973 and 2003 * * Source: International Energy Agency 2005 megaton oil equivalent
Map ProjectionGeographic Map DescriptionThis map illustrates historic cumulative carbon emissions from 1950 - 1999 (as a percentage of global output) at a country-level . As indicated on the map, areas with highest cumulative emissions are predominantly found in "northern" richer nations such as the U.S. (at 27%) and the EU (at 18%). Alternatively, lowest carbon emissions are found in economically challenged
The Result of Global Inequality is Gross Carbon Inequality World Average CO2 Emissions Per Capita, 2000: 1.56 Tons Rich countries emit around 2.5-6 metric tons carbon annually per person, while the middle income nations are around 0.6 mT and the poorest around 0.02 mT Source: Boden, 2003
Some definitions • Mitigation: The notion of limiting or controlling emissions of greenhouse gases so that the total accumulation is limited. • Adaptation: The notion of making changes in the way we do things to adapt to changes in climate. • Resilience: The ability to adapt. • Geo-engineering: The notion that we can manage the balance of total energy of the atmosphere, ocean, ice, and land to yield a stable climate in the presence of changing greenhouse gases.
Global cooling? Why do we think that our predictions today are more robust than these predictions from the 1970s?
Medieval warm period • “Little ice age” • Temperature starts to follow CO2 as CO2 increases beyond approximately 300 ppm, the value seen in the previous graph as the upper range of variability in the past 350,000 years. Let’s look at just the last 1000 years Surface temperature and CO2 data from the past 1000 years. Temperature is a northern hemisphere average. Temperature from several types of measurements are consistent in temporal behavior.
What do we know from model experiments and evaluation (validation) with observations • With consideration of solar variability and volcanic activity, the variability in the temperature record prior to 1800 can be approximated. • After 1800 need to consider the impact of man • Deforestation of North America • Fossil fuel emission • Change from coal to oil economy • Clean air act? • Only with consideration of CO2, increase in the greenhouse effect, can the temperature increase of the last 100 years be modeled. We will revisit this in more detail after we learn about models.
Consideration of the past record • Recorded human history has taken place in a period of relatively warm climate. • Since the last ice age there have been warm and cold periods where the global average temperature varies by approximately 0.5 degrees F. • These changes have been accompanied by discernable impact on human activities. • In the past 100 years we have seen an increase of #### degrees. • Do you feel that there has been impact on humans? • In the next 100 years we expect to see ~ 3.0 – 10.0 rise in global average temperature. • It is reasonable to expect impact on human activities.
New Regimes of Climate Behavior? NEW AGE? ~500 ppm • Differences for the Future (100-200 years) • ~100 ppm CO2 (Already) • > 200-300 ppm CO2 certain • ~ 8-20 C polar T difference • ~ 2-6 C global average T difference CURRENT (360 ppm) Behavior of water; Phase change • Differences from Past (20,000 years) • ~100 ppm CO2 • ~ 20 C polar T difference • ~ 5 C global average T difference ICE AGE ~200 ppm Time gradient of CO2 changes, 2 orders of magnitude (100 times) larger.