Download
1 / 53
530 likes | 538 Views
Module 3 Introduction Content Area: Analytical Epidemiology Essential Question (Generic): Is there an association between the hypothesized cause and the disease?

E N D
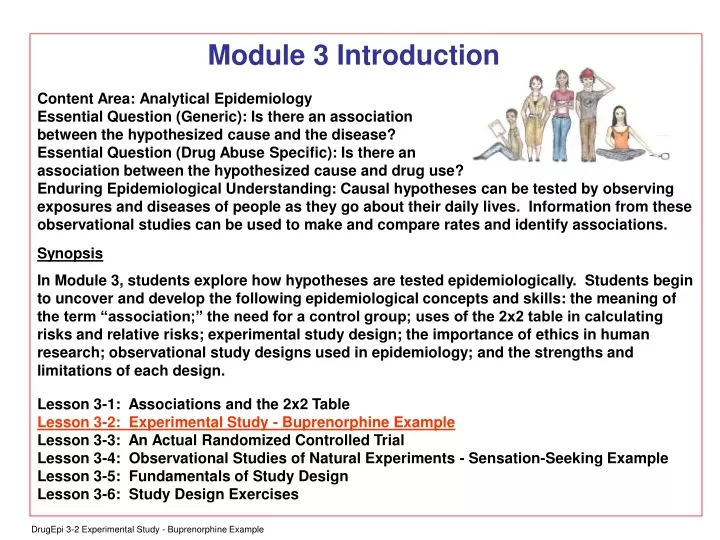
Module 3 Introduction Content Area: Analytical Epidemiology Essential Question (Generic): Is there an association between the hypothesized cause and the disease? Essential Question (Drug Abuse Specific): Is there an association between the hypothesized cause and drug use? Enduring Epidemiological Understanding: Causal hypotheses can be tested by observing exposures and diseases of people as they go about their daily lives. Information from these observational studies can be used to make and compare rates and identify associations. Synopsis In Module 3, students explore how hypotheses are tested epidemiologically. Students begin to uncover and develop the following epidemiological concepts and skills: the meaning of the term “association;” the need for a control group; uses of the 2x2 table in calculating risks and relative risks; experimental study design; the importance of ethics in human research; observational study designs used in epidemiology; and the strengths and limitations of each design. Lesson 3-1: Associations and the 2x2 Table Lesson 3-2: Experimental Study - Buprenorphine Example Lesson 3-3: An Actual Randomized Controlled Trial Lesson 3-4: Observational Studies of Natural Experiments - Sensation-Seeking Example Lesson 3-5: Fundamentals of Study Design Lesson 3-6: Study Design Exercises
Module 3 - Analytical Epidemiology • Lesson 3-2 Experimental Study - Buprenorphine Example • Content • Continued study of the concepts of “association” and hypothesis-testing • Use of the 2x2 table as a way to numerically express risk and relative risk • Example of an experimental study to examine beneficial health-related effects • Understanding of population sampling and inference • Demonstration of the necessity and impact of a control group • Big Ideas • An experimental study of a sample of a population can test a hypothesized association between an exposure and a beneficial health-related outcome • In order for an experimental study to be meaningful, it has to include controls • The 2x2 table, which includes consideration of a control group, is a tool used to express the numbers of people with and without the exposure, and with and without the outcome, and clarifies how rates and relative risks are calculated. This project is supported by a Science Education Drug Abuse Partnership Award, Grant Number 1R24DA016357-01, from the National Institute on Drug Abuse, National Institutes of Health.
Where are we? Essential Questions Enduring Understandings
Review of the Concept of Association Tied Related Associated Linked What do we mean when we say that there is anassociationbetween two things? Things that are associatedare linked in some way that makes themturn up together.
Review - Things That Turn Up Together Suicide Higher in Areas with Guns Smoking Linked to Youth Eating Disorders Family Meals Are Good for Mental Health Study Links Iron Deficiency to Math Scores Study Concludes: Movies Influence Youth Smoking Lack of High School Diploma Tied to US Death Rate Study Links Spanking to Aggression Depressed Teens More Likely to Smoke Snacks Key to Kids’ TV- Linked Obesity: China Study Breakfast Each Day May Keep Colds Away Pollution Linked with Birth Defects in US Study Kids Who Watch R-Rated Movies More Likely to Drink, Smoke
Review - Module 3 is about Analytical Epidemiology Epidemiologic studies that are concerned with determinants of disease and the reasons for relatively high or low frequencies of disease in specific population subgroups Analytical epidemiology can test hypothesesabout associations
Generate Test Descriptive Epidemiology Analytical Epidemiology Review - Epidemiology and Associations Hypothesis about associations An unproven idea, based on observation or reasoning, that can be supported or refuted through investigation An educated guess Hypotheses in epidemiology are statements that suggest associations between an exposure and an outcome
Testing Hypotheses Hypothesis: Buprenorphine will stop heroin addicts from using heroin.
10 Weeks Buprenorphine will stop heroin addicts from using heroin. Trial 1 Sample 100 Heroin Addicts 79 Heroin Addicts Tested Positive for Heroin
Buprenorphine will stop heroin addicts from using heroin. Trial 1 Tested Positive for Heroin Tested Negative for Heroin Total Bupe 79 21 100
Lord Kelvin When you can measure what you are speaking about, and express it in numbers, you know something about it. But when you cannot measure it, when you cannot express it in numbers, your knowledge is of a meager and unsatisfactory kind.
Numerator Outcome Review - Express It In Numbers RATE A measure of how often an outcome occurs in a defined population in a defined period of time. It consists of a numerator and a denominator. Denominator The numerator is the number of people in the population or sample who experienced the outcome and the denominator is the total number of people in the population or sample. Population / Sample
Concepts of Rate and Risk Rate: A measure of how often an outcome occurs in a defined group of people in a defined period of time. Risk: The likelihood of an outcome occurring in a defined group of people in a defined time period.
Express It In Numbers Numerator 79 tested positive for heroin 100 study subjects Denominator … the rate of positive heroin tests is 79/100 positives per 10-week period
79 % or Calculating a Rate / Risk in Trial 1 Trial 1 Tested Positive for Heroin Tested Negative for Heroin Tested Rate of Using Heroin Total 79 Bupe 79 21 100 100
Inference Process of predicting from what is observed in a sample to what is true for the entire population.
79 % or What Can Trial 1 Tell Us About the Hypothesis? Trial 1 Tested Positive for Heroin Tested Negative for Heroin Tested Rate of Using Heroin Total 79 Bupe 79 21 100 100 What does this tell you about the hypothesis?
Control Group People who participate in a trial, but do not get the treatment. People whose results are compared to the group that was treated.
79 % or Including a Control Group Tested Positive for Heroin Tested Negative for Heroin Tested Rate of Using Heroin Total 79 Bupe 79 21 100 100 Extend and label the table to include a control group.
79 % or ? ? % or 100 Including a Control Group Tested Positive for Heroin Tested Negative for Heroin Tested Rate of Using Heroin Total 79 Bupe 79 21 100 100 No Bupe 100
Outcome / Disease Exposure 79 % or ? ? % or 100 2x2 Table Tested Positive for Heroin Tested Negative for Heroin Tested Rate of Using Heroin Total a b 79 Bupe 79 21 100 100 c d No Bupe 100
Review - Contingency Table A cross-classification of data where categories of one variable are presented in rows and categories of another variable are presented in columns. The simplest contingency table is the 2x2 table
10 Weeks Testing Hypotheses - Buprenorphine Trial 1 Trial 1 Sample 100 Heroin Addicts 79 Heroin Addicts Tested Positive for Heroin
2x2 Table for Trial 2 Trial 2 Tested Positive for Heroin Tested Negative for Heroin Tested Rate of Using Heroin Total ? ? % Bupe 100 100 a b c d ? No Bupe 100 ? % 100
O E O Assigned Heroin Addicts Volunteer Heroin Addicts O E O Time Study Diagram
Trial 2 Study Sample Assign Volunteers to 2 Groups Trial 2
Trial 2 Results Trial 2 Tested Positive for Heroin Tested Negative for Heroin Tested Rate of Using Heroin Total 79 Bupe 79% 79 21 100 or 100 a b c d 79 No Bupe 79 21 100 79% or 100
Ratio The value obtained by dividing one quantity by another.
Risk Ratio Comparing Rates - A Risk Ratio for Trial 2 Trial 2 Tested Positive for Heroin Tested Negative for Heroin Tested Rate of Using Heroin Total 79 Bupe 79% 79 21 100 or 100 a b c d 1 79 No Bupe 79 21 100 79% or 100 Ratio: The value obtained by dividing one quantity by another Risk Ratio: The ratio of two risks
Risk Ratio a a + b c c + d A Formula for Comparing Rates Create a formula Tested Positive for Heroin Tested Negative for Heroin Tested Rate of Using Heroin Total 79 Bupe 79% 79 21 100 or 100 a b c d 1 79 No Bupe 79 21 100 79% or 100 Risk Ratio: The ratio of two risks.
Relative Risk Relative Risk Risk Ratio Risk Ratio Trial 2 Tested Positive for Heroin Tested Negative for Heroin Tested Rate of Using Heroin Total 79 Bupe 79% 79 21 100 or 100 a b c d 1 79 No Bupe 79 21 100 79% or 100 Relative Risk: The ratio of the risk of an outcome among the exposed to the risk of the outcome among the unexposed.
Risk Ratio Trial 2 Inference Trial 2 Tested Positive for Heroin Tested Negative for Heroin Tested Rate of Using Heroin Relative Risk Total 79 Bupe 79% 79 21 100 or 100 a b c d 1 79 No Bupe 79 21 100 79% or 100 Inference: Process of predicting from what is observed in a sample to what is occurring in the entire population The inference here is that there is no effect of Buprenorphine
2x2 Table for Trial 3 Trial 3 Tested Positive for Heroin Tested Negative for Heroin Tested Rate of Using Heroin Total ? ? % Bupe 100 100 a b c d ? No Bupe 100 ? % 100
Trial 3 Study Sample Buprenorphine No Buprenorphine Trial 3
Trial 3 Results Trial 3 Tested Positive for Heroin Tested Negative for Heroin Tested Rate of Using Heroin Total 79 Bupe 79% 79 21 100 or 100 a b c d 38 No Bupe 38 62 100 38% or 100
Trial 3 Relative Risk Trial 3 Tested Positive for Heroin Tested Negative for Heroin Tested Rate of Using Heroin Relative Risk Total 79 Bupe 79% 79 21 100 or 100 a b c d 2.08 38 No Bupe 38 62 100 38% or 100 Relative Risk: The ratio of the risk of an outcome among the exposed to the risk of the outcome among the unexposed.
Trial 3 Relative Risk Trial 3 Tested Positive for Heroin Tested Negative for Heroin Tested Rate of Using Heroin Relative Risk Total 79 Bupe 79% 79 21 100 or 100 a b c d 2.08 38 No Bupe 38 62 100 38% or 100 The heroin addicts who received Buprenorphine were ____ times as likely to use heroin as those who did not receive Buprenorphine. 2.08
Trial 3 Inference Trial 3 Tested Positive for Heroin Tested Negative for Heroin Tested Rate of Using Heroin Relative Risk Total 79 Bupe 79% 79 21 100 or 100 a b c d 2.08 38 No Bupe 38 62 100 38% or 100 Inference: Process of predicting from what is observed in a sample to what is occurring in the entire population.
2x2 Table for Trial 4 Trial 4 Tested Positive for Heroin Tested Negative for Heroin Tested Rate of Using Heroin Total ? ? % Bupe 100 100 a b c d ? No Bupe 100 ? % 100
Trial 4 Study Sample Buprenorphine No Buprenorphine Trial 4
Trial 4 Results Trial 4 Tested Positive for Heroin Tested Negative for Heroin Tested Rate of Using Heroin Total 79 Bupe 79% 79 21 100 or 100 a b c d 94 No Bupe 94 6 100 94% or 100
Trial 4 Relative Risk Trial 4 Tested Positive for Heroin Tested Negative for Heroin Tested Rate of Using Heroin Relative Risk Total 79 Bupe 79% 79 21 100 or 100 a b c d .84 94 No Bupe 94 6 100 94% or 100 Relative Risk: The ratio of the risk of an outcome among the exposed to the risk of the outcome among the unexposed.
Trial 4 Relative Risk Trial 4 Tested Positive for Heroin Tested Negative for Heroin Tested Rate of Using Heroin Relative Risk Total 79 Bupe 79% 79 21 100 or 100 a b c d 0.84 94 No Bupe 94 6 100 94% or 100 The heroin addicts who received Buprenorphine were ____ times as likely to use heroin as those who did not receive Buprenorphine. 0.84
Trial 4 Inference Trial 4 Tested Positive for Heroin Tested Negative for Heroin Tested Rate of Using Heroin Relative Risk Total 79 Bupe 79% 79 21 100 or 100 a b c d 0.84 94 No Bupe 94 6 100 94% or 100 Inference: Process of predicting from what is observed in a sample to what is not observed in a population.
Review of the Four Hypothetical Trials Trial 1 Tested Positive for Heroin Tested Negative for Heroin Tested Rate of Using Heroin Total 79 Bupe 79% 79 21 100 or 100 a b c d Nothing What do the results of tell us about the hypothesis that Buprenorphine will stop heroin addicts from using heroin?
Tested Positive for Heroin Tested Negative for Heroin Rate of Using Heroin Tested Positive for Heroin Tested Negative for Heroin Rate of Using Heroin Relative Risk Total Total 79 79 79 79 90 90 90 90 Bupe Bupe 79% 79% 79% 79% 79 79 79 79 21 21 21 21 100 100 100 100 or or or or 100 100 100 100 No Bupe Tested Positive for Heroin Tested Negative for Heroin Rate of Using Heroin Tested Positive for Heroin Tested Negative for Heroin Rate of Using Heroin Relative Risk Relative Risk Total Total Bupe Bupe No Bupe No Bupe Review of the Four Hypothetical Trials Trial 1 Trial 2 Nothing Trial 3 Trial 4
Tested Positive for Heroin Tested Negative for Heroin Rate of Using Heroin Tested Positive for Heroin Tested Negative for Heroin Rate of Using Heroin Relative Risk Total Total 79 79 79 79 79 90 90 90 90 90 Bupe Bupe 79% 79% 79% 79% 79% 79 79 79 79 79 21 21 21 21 21 100 100 100 100 100 or or or or or 100 100 100 100 100 No Bupe Tested Positive for Heroin Tested Negative for Heroin Rate of Using Heroin Tested Positive for Heroin Tested Negative for Heroin Rate of Using Heroin Relative Risk Relative Risk Total Total Bupe Bupe No Bupe No Bupe Review of the Four Hypothetical Trials Trial 1 Trial 2 1 Nothing There is no association between Bupe and heroin use. Trial 3 Trial 4
Tested Positive for Heroin Tested Negative for Heroin Rate of Using Heroin Tested Positive for Heroin Tested Negative for Heroin Rate of Using Heroin Relative Risk Total Total 79 79 79 79 79 90 90 90 90 90 Bupe Bupe 79% 79% 79% 79% 79% 79 79 79 79 79 21 21 21 21 21 100 100 100 100 100 or or or or or 100 100 100 100 100 No Bupe Tested Positive for Heroin Tested Negative for Heroin Rate of Using Heroin Tested Positive for Heroin Tested Negative for Heroin Rate of Using Heroin Relative Risk Relative Risk Total Total Bupe Bupe No Bupe No Bupe 38 90 38% 38 62 100 or 100 Review of the Four Hypothetical Trials Trial 1 Trial 2 1 Nothing There is no association between Bupe and heroin use. Trial 3 Trial 4 2.08 Bupe is associated with an increase in heroin use.
Tested Positive for Heroin Tested Negative for Heroin Rate of Using Heroin Tested Positive for Heroin Tested Negative for Heroin Rate of Using Heroin Relative Risk Total Total 79 79 79 79 79 90 90 90 90 90 Bupe Bupe 79% 79% 79% 79% 79% 79 79 79 79 79 21 21 21 21 21 100 100 100 100 100 or or or or or 100 100 100 100 100 No Bupe Tested Positive for Heroin Tested Negative for Heroin Rate of Using Heroin Tested Positive for Heroin Tested Negative for Heroin Rate of Using Heroin Relative Risk Relative Risk Total Total Bupe Bupe No Bupe No Bupe 94 90 38 90 94% 94 6 100 or 38% 38 62 100 or 100 100 Review of the Four Hypothetical Trials Trial 1 Trial 2 1 Nothing There is no association between Bupe and heroin use. Trial 3 Trial 4 .84 2.08 Bupe is associated with a decrease in heroin use.