Download
1 / 31
310 likes | 426 Views
Modeling of Actual Crop Water Consumption Using Optical-Thermal Satellite and Airborne Data Over Murrumbidgee Catchment. Mohsin Hafeez, Shahbaz Khan, Kaishan Song, Umair Rabbani, Jeff Walker CSIRO Land and Water Division, Wagga Wagga

E N D
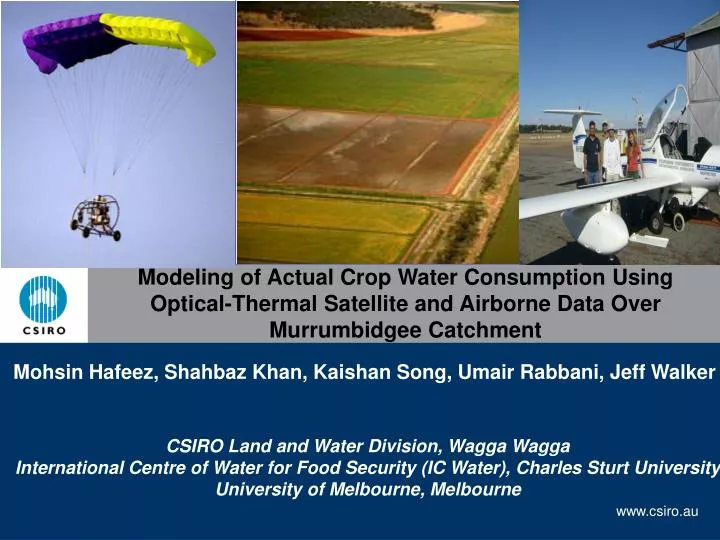
Modeling of Actual Crop Water Consumption Using Optical-Thermal Satellite and Airborne Data Over Murrumbidgee Catchment Mohsin Hafeez, Shahbaz Khan, Kaishan Song, Umair Rabbani, Jeff Walker CSIRO Land and Water Division, Wagga Wagga International Centre of Water for Food Security (IC Water), Charles Sturt University University of Melbourne, Melbourne
Outline • Research Issues in ET modeling • Satellite Data • Initial Results • Still to achieve science goals from NAFE Campaign • Ongoing Research Projects
Water losses and gains are part of the water cycle ET is important at all scales loss crop farm irrigation area gain catchment surface groundwater Basin
Key Research Issues • ET is coupled mass/energy process, linking the energy and water cycles • Estimation of ET is critical for on-farm and regional models in irrigation systems • ET is the largest water balance component after rainfall and irrigation input • Water quantification (i.e. productive and non-productive use) is important for irrigated agriculture.
Current state-of-the-art Approaches for measuring Actual ET • In-situ measurement (Bowen ratio tower, & soil water balance, etc.) • Air-borne measurement (fluxes) • Satellite measurement • High Spatial Resolution (ASTER and Landsat) • High Temporal Resolution (MODIS and NOAA-AVHRR) • Modelling Approaches (plant to catchment)
The challenge in ET Modeling…. We can’t cover everythingall of the time… • in-situ observations:(lysimeters, flux towers) cover almost nothing but most of the time cover almost everything but hardly ever • aircraft observations:(fluxes, concentrations) • satellite observations:(AVHRR, MODIS … ) cover everythingall of the time but not at the time when we want! • modelling:(leaf …. region) only pretends to cover everything all of the time Modified from Dr Schmid, Indiana University
Methods for Quantification of Actual ET • Empirical direct methods • Characterizing crop water status through the cumulative temperature difference (Ts-Ta) • Residual methods of the energy budget • Combination of empirical relationship and physical modules (SEBAL, SEBS) • Deterministic methods • Soil-Vegetation-Atmosphere Transfer models (SVAT) • Vegetation Index methods
National Airborne Field Experimentation (NAFE) 2006 Kyeamba Creek Catchment (600 km2) Yanco area (2500 km2)
R n ET = R - G - H n Remote Sensing for Actual ET Estimation • ET is calculated as a “residual” of the energy balance (radiation from sun and sky) ET H (heat to air) Basic Truth: Evaporation consumes Energy The energy balance includes all major sources (Rn) and consumers (ET, G, H) of energy G (heat to ground) Adapted from IDAHAO
ET = R - G - H n Pre-Processing of SEBAL Modelling • Quality Check Using TiSEG Software • NDVI • Surface Albedo • Surface Emissivity • Surface Temperature • LAI • Solving Energy Balance at Satellite Overpass
October 31 Using SEBAL-METRIC Aqua MODIS (Spatial Resolution 1000 m)
November 11 Using SEBAL-METRIC Terra MODIS (Spatial Resolution 1000 m)
November 14 Using SEBAL-METRIC Terra MODIS (Spatial Resolution 1000 m)
November 22 Using SEBAL-METRIC Terra MODIS (Spatial Resolution 1000 m)
Seasonal Actual Evapotranspiration Yanco Area April –March Terra MODIS (Spatial Resolution 1000 m)
Reference ET Using Penman Monteith Method CSIRO Weather Station at Y11- Morundah
Still to Achieve Scientific Goals from NAFE • Actual crop water consumption and deficit using ASTER, Landsat 5 TM and NOAA-AVHRR satellite data over Yanco and Kyeamba Creek • Uncertainty analysis of remote sensing based algorithms; • Processing high resolution airborne thermal data; • Modelling using airborne data to estimate actual evapotranspiration: • Up-down scaling approaches in ET; and • Validation of remote sensing derived ET by ground fluxes.
Surface Energy Balance System (SEBS) (Su, 2002)
Work in Progress From NAFE CampaignSpatial Actual ET • TRI-Spectral NDVI Scanner • Thermal Imager • LIDAR • Eddy Covariance Flux Tower
Processing of Thermal Imager Data • Lens calibrations • Correction of various distortions • Aircraft Altitude & terrain • Georeferencing of composite data • Methods: Atmospheric corrections using ATCOR • LST Retrieval: Qin et al., 2001, Sobrino et al., 2003 • Composite Images: Autopano, FLIR Image Builder, ENSOMOSAIC
Ongoing Research Projects • Mapping, Monitoring and Modelling of Hydrological Parameters in the Lower Murrumbidgee Catchment of Australia; DLR-UNESCO HELP Project • Development of SAM-ET for mapping water productivity in Australian Irrigated Ecosystems; NWC Project • Spatio-temporal water accounting framework through coupling of ground and remote sensing data at on-farm and regional level in a real time environment; NWC Project • System Harmonisation through Regional Irrigation Business Partnerships (RIBP) across Australia; CRC IF Project
Remote Sensing Based Water Productivity Algorithm • Develop a spatio-temporal water accounting and productivity framework through coupling of ground and remote sensing data at on-farm and regional level; • Develop a remote sensing based algorithm for estimating an actual ET (SAM-ET) in irrigation systems within Australian agro-climate context and validate them with in-situ measurements e.g. by flux towers; • Establish up-to-date land cover and land use classification of the irrigation areas using high spatial resolution TerraSAR-X, Rapid Eye and ALOS/PRISM data; • Develop biophysical remote sensing models for monitoring of vegetation health through parameterization of NDVI, LAI, and NPP using high spatial and temporal resolution satellites; • Uncertainty analysis of different ET based algorithms: and • Develop a Spatial Algorithm for Mapping water productivity and vegetation health frameworks at different scales (farm, irrigation system and basin).
Water Accounting at Catchment Scale Water Accounting Concept (IWMI, 1998)
Scaling Issues in ET • Up-Down scaling Approaches • Satellites: GEOS (4000m) - Terra/MODIS (1000m) - ASTER (90m) - Landsat 5 TM/ 7 ETM+ (30m) • Airborne observations at a range of altitudes (500ft to 10,000ft) equipped with Thermal Imager and NDVI scanner (1m to 20m) • Drone observations at 500 ft altitudes equipped with Thermal Imager and NDVI scanner (<1m) • Ground observations from sensorscope stations located at strategic points • Verifications and validations with • Point observation networks using weather stations • Eddy covariance system (100m) • Large - Very large Aperture Scintillometers (5000m to 10,000m)
Drone – Monitoring of Hotspots in Irrigation Areas Description: Flight weight: ca. 8-12 kg Time of flight: > 90 min Range: ca. 5 km Max speed: 30 km Max flight hight: ca. 4500 m Carrying capacity: ca. 5-6 kg Engine: 2-stroke, 5.5 h Sensor:Digitalcamera, Multispectral camera, Thermal imager Fail save functions Real time transfer of GPS position data and camera field of view to operator
RapidEye High resolution imagery everyday everywhere • Mission: Monitoring of earth surfaces with daily revisit • 5 identical small satellites in a common orbital plane • 5 bands (400-800nm), resolution: 6.5 m, swath: 78 km • Launch: November 2007 • Commercial initiative of RapidEye AG (www.rapideye.de) with financial support from DLR • Scientific exploitation and data access through DLR • Coleambally Irrigation Area (CIA) – Demonstration Site
Way Forward • Actual crop water consumption and deficit using ASTER, Landsat 5 TM and NOAA-AVHRR satellite data over Yanco and Kyeamba Creek; • Uncertainty analysis of remote sensing based algorithms and validation of derived ET by ground fluxes; • Modelling using airborne data to estimate actual evapotranspiration; • Mapping, Monitoring and Modelling of Hydrological Parameters in the Lower Murrumbidgee Catchment of Australia; • Development of SAM-ET for mapping water productivity in Australian irrigated Ecosystems; and • Spatio-temporal water accounting framework through coupling of ground and remote sensing data at on-farm and regional level in a near real time environment.