Download
1 / 17
170 likes | 302 Views
S290: Quantitative Methods for Improving Causal Inference in Educational Research Class #01: The Formal Design of Experiments. Sample. Draw a random sample. In an ideal world unicorns exist, and this is what we would need to do to prove that a “ treatment ” caused an “ effect ” ….

E N D
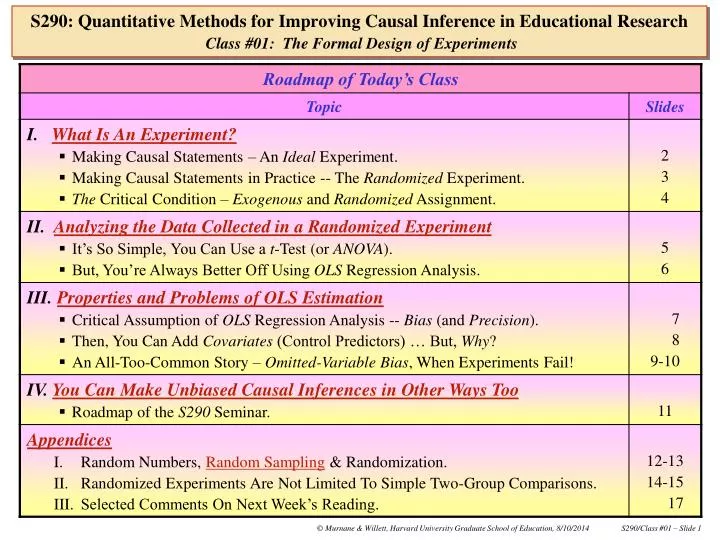
S290: Quantitative Methods for Improving Causal Inference in Educational ResearchClass #01: The Formal Design of Experiments
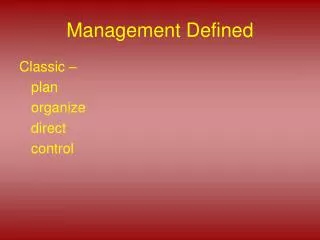
Sample Draw a random sample ... In an ideal world unicorns exist, and this is what we would need to do to prove that a “treatment” causedan “effect” … Sample Defined Population S290: Quantitative Methods for Improving Causal Inference in Educational ResearchMaking Causal Statements – An “Ideal” Experiment and also concurrently not implement it … a perfect counterfactual!!! (We would need to turn back the clock, mysteriously erasing all impact/memory of the treatment and returning participants to their original pristine condition). Hypothetically, we could then implement the treatment for each participant … • While we can’t do this in practice, there is nothing to stop us imagining… hypothetically, at least, that each participant in the population has a value of the outcome that would “potentially” be revealed under the corresponding experimental condition: • Yi(1) = Potential value of the outcome for ith person, when treated (Ti = 1). • Yi(0) = Potential value of the outcome for ith person, when not treated (Ti = 0) … then, • And if the ATE differed from zero, we could claim that the treatment caused the effect, in the population: • Why? Because there would be no other explanation for the differences detected between the “treated” and “control” conditions other than participants’ experience of the treatment! • The Individual Treatment Effect (ITE) is then: • Difference in potential outcome values between treated & control conditions, for each person. • And Average Treatment Effect (ATE) in the population is: • Average the individual treatment effects across all participants, in the population.
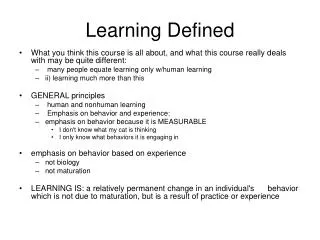
Sample Randomly select … An “ideal” experiment is not possible in practice because the same group of people cannot both experienceand notexperiencetreatment … you have a missing-data problem! So, while you may not be able to estimate individual treatment effects in practice, you may still be able to estimate the average treatment effect ... if your conduct a randomized experiment! Defined Population S290: Quantitative Methods for Improving Causal Inference in Educational ResearchMaking Causal Statements In Practice – The Randomized Experiment Then, randomly assign each participant … … either to theTreatment Group where they are treated, and their value of the outcome, Yi(1), is measured. … or to the Control Group, where they are not treated, and their value of the outcome, Yi(0), is measured. • Providing your random assignment is credible, you can estimate the population Average Treatment Effectas a difference of treatment and control group sample means: • And, if we can reject the null hypothesis that the ATE differs from zero, in the population, we can claim the treatment caused the effect: • Why? Because random assignment to experimental conditions hasensured that the treatment and control groups were identical on average in the population(“Equal in Expectation”) before treatment onset.
Big idea in a randomized experiment is that treatment variationisexogenously& randomly assigned … An external (“exogenous”) agent (the investigator) determines who is treated(Ti = 1) and who is not(Ti = 0) … by randomly assigning each participant to an experimental condition. In particular, participants themselves have no say! S290: Quantitative Methods for Improving Causal Inference in Educational ResearchA Critical Requirement -- Exogenous & Random Treatment Assignment! • This ensures that: • Values of all observed and unobserved characteristics of the participants are randomizedacross treatment and control groups. • Members of the treatmentandcontrol groupsare thenequal, on average, in the population(“Equal in Expectation”) before the experiment begins, on every possible dimension. • As an added benefit,this means that the values of treatment variable, T, will also be completely uncorrelatedwith all characteristics of participants, observed and unobserved, in the population. It is the presence of exogenous and random treatment variation that validates the causal attributions – that is, it ensures the internal validity of an experiment.
Sample Control Group (Ti=0) n0 cases Mean of outcome, St. dev. of outcome, s0 Treatment Group (Ti=1) n1 cases Mean of outcome, St. dev. of outcome, s1 No need for a pre-test, No need for controls, No need for complex analyses, … Just estimate and examine the difference in averageoutcome between the Treatment and Control Groups The great thing about doing an experiment is … the cleaner the design, the simpler the data-analysis … S290: Quantitative Methods for Improving Causal Inference in Educational ResearchIt’s Easy to Analyze Data From Randomized Experiments Using a t-Test, or ANOVA
Sample Control Group (Ti=0) n0 cases Mean of outcome, St. dev. of outcome, s0 Treatment Group (Ti=1) n1 cases Mean of outcome, St. dev. of outcome, s1 This model specifies that, in the population: The t-test associated with parameter 1 in an OLSregression analysis of the same data is identical to the t-test offered on the previous slide … Still no need for a pre-test, Still no need for controls, Still no need for complex analyses, … The estimated regression parameter is the difference in average outcome!!! And hence the OLS regression slope associated with the treatment dummy, , is the estimated average treatment effect. You don’t actually need to conduct a t-test, you can use OLS regression analysis to get an identical answer … S290: Quantitative Methods for Improving Causal Inference in Educational ResearchBut, You’re Better Off Using OLS Regression Analysis
In OLS regression analysis, we usually say that the “residuals must be distributed randomly” … • What we actually mean by this is that we are assuming that theresiduals are uncorrelatedwith everything else, including anypredictor(s) in the model. • If they are not, then OLS provides biased estimates of the underlying population parameters! Unbiased estimate Biased estimate S290: Quantitative Methods for Improving Causal Inference in Educational ResearchCritical Assumption of OLS Regression Analysis (Bias and Precision)! Critically, in an experiment, the most important assumption of OLS regression analysis is automatically satisfied … If residuals and predictor(s), are uncorrelated, then OLS estimates of regression parameters are unbiased. If residuals and predictor(s), are correlated, then OLS estimates of regression parameters are biased. What is Bias?... in repeated sampling from a population … … because, if when the values of the treatment predictor have been assigned at random, then the “treatment” predictor will be uncorrelated automatically with everything, including the residuals (in the population).
If you add covariate Z to the regression model, the part of Y that is now predicted by Z must have been part of the earlier residual (and not part of the variation in Y that has been predicted by T) because Z and T are uncorrelated, by randomization). Variation in Y Now Predicted by Z If analyses are so simple with data from a randomized experiment, why do folk complicate their work by adding control predictors (“covariates”) to OLS regression analyses of experimental data? Beforecovariate added … Residual Variation in Y Before including Z S290: Quantitative Methods for Improving Causal Inference in Educational ResearchThen You Can Add Covariates (Control Predictors) … But, Why? Total Variation in Y Total Variation in T Variation in Y Predicted by T Variation in Y Predicted by T Aftercovariate added … • Reducedresidual variance means better precision (smallerstandard error) for the estimated treatment effect: • Smaller standard error means largert-statistic: • Larger t-statisticmeans a smaller p-value, which meansyou have more power to reject H0. Residual Variation Is Smaller After Z is included
Now, because the residuals contain the effect of the omitted predictor, Motivation, they must be correlated with T. Why? Because the values of T are now correlated with student motivation, by the selection that occurred … BIAS, BIAS, BIAS! If students can self-select into classes, perhaps their selection will be driven by an unobserved characteristic, like Motivation. Maybe more motivated students, seek admission to small classes? So, after their choices,Twill be correlated with Student Motivation. But, we have just admitted that the offending (unobserved) characteristic (Motivation) impacts the outcome. So, if it has been omitted as a predictor, its effect must naturally reside surreptitiously in the residual (where all omitted effects on the outcome go to die). There is a story you will hear repeatedly … An Experiment Will Fail – And Its Findings Will Be Biased – If Participants Can Choose Their Own Experimental Conditions … If Treatment Assignment Is Endogenous … Student Achievement? Small vs. Large Classes S290: Quantitative Methods for Improving Causal Inference in Educational ResearchA Common Story When Experiments Fail – “Omitted Variable” Bias! We have notincluded the offending unobserved participant characteristic (Motivation) in the model as an explicit predictor … But, what if Student Motivation also impacts the Achievement outcome?
Pull the offending omitted variable (motivation?) out of the residual. Include it as a predictor in the regression model … This leaves the treatment predictor and the residual again uncorrelated … now, our OLSestimate of the treatment effect will again be unbiased. But, what about competitiveness, family wealth, … • If treatment assignment is not random, there may be some other unobserved characteristic related to treatment assignment that has also been omitted? • How would you ever know that you had included all the needed controls! • So, an unknown random biasis always possible regardless of how many covariates you include!!!!! • Be careful when experiments fail! You might react by saying, “Well, then, let’s include motivation as a predictor!” … and you’d be right … S290: Quantitative Methods for Improving Causal Inference in Educational ResearchA Common Story When Experiments Fail – “Omitted Variable” Bias!
In addition to trueexperiments in which an “exogenous” investigator takes charge of the randomization to experimental conditions, there are other strategies and situations that can support unbiased causal attribution … • Natural Experiments: • You can sometimes locate exogenous variation in assignment to treatments that has been enforced “by nature,” rather than the investigator. • Perhaps due to unanticipated policy shifts and natural disasters, random events, and the like. • Regression-Discontinuity Designs: • You can capitalize on some ubiquitous initial ranking or arraying of participants, and the exogenous imposition of a cut-score or boundary to create “haves” and “have-nots.” • Natural experiments often fall into this category. • Instrumental Variables Estimation: • You can sometimes tease out analytically the exogenous component of otherwise endogenous treatment variation. • Often, this permits making causal inferences in observational data, or when an experiment has failed. • Model, and Account for, Endogenous Selection: • You can resolve treatment assignment bias(and sample selection bias) by modeling the selection process explicitly and using analytic bias-correction methods, like propensity score estimation. • And You Can Dream on … S290: Quantitative Methods for Improving Causal Inference in Educational ResearchOther Than Experiments … What Then Can You Do?
Random numbers were first created using dice in ancient Sumeria, an effective but inefficient and potentially flawed process (see graphic on right). • Up until the 20th century, random numbers were generated by tossing coins, rolling dice, dealing cards, picking ping-pong balls out of urns, etc. • In 1927, statistician L.H.C. Tippett published a list of 41,600 “random” numbers by picking out the middle digits of measurements of the areas of English churches (!!!). • In 1955, Rand Corporation published A Million Random Numbers With 100,000 Normal Deviates (but, was it peer-reviewed?) • Today, there are random number generators on the WWW. S290: Quantitative Methods for Improving Causal Inference in Educational ResearchAppendix I: Random Numbers, Random Sampling & Randomization It’s hard to ensure true randomness How do you know there are no trends or biases hidden deep in the list of random numbers (or even secret messages hidden by the Architect)?
8 How do you use a random number table toselect people? • Obtain an initial random start by some reasonable mechanical means, and note the random number in that cell. • Count down from that cell, a number of cells equal to the initial random number. • The new cell now contains your first true random number. • Starting with the number in this cell, assign random ID numbers to each person… • For random selection, assign a random ID number to each person in the population. • For random assignment, assign a random ID number to each person in the sample. • In either case, adopt a sensible rule that uses the random ID numbers to accept or reject each person: • For random selection, order the individuals in the population by their random ID and sample the number of participants that you need from the top of the list. • For random assignment, order the individuals in the sample by their random ID and alternately assign them to treatment and control groups. • Etc. S290: Quantitative Methods for Improving Causal Inference in Educational ResearchAppendix I: Random Numbers, Random Sampling & Randomization In a table of random numbers, every sequence of numbers listed in any direction is random – any column or row of single digits, columns and rows of double digits, columns and rows of triple digits, etc. You choose the number of digits you use in order to match the size of the problem you’re addressing.
Situated Science Learning in Multi-User Virtual Environments(Dede, 2004) • Interactive 3-D virtual environment called “River City,” learners collaborate as scientists to resolve environmental and health problems. • Research Question: Are student science achievement and attitudes towards science enhanced by apprenticeship learning? • Outcome: Science achievement and attitudes. • Experimental Conditions provide educational supports according to four theories of learning: • Treatment #1: Expert Coaching. • Treatment #2: Peripheral Participation. • Treatment #3: Pure Constructivist. • Control: Constructivist without Technology. • Tennessee Student/Teacher Achievement Ratio (STAR) Experiment (Krueger, 1999) • Research Question: Is academic achievement enhanced when students are taught in smaller classes? • Outcome: Student achievement. • Experimental Conditions: • Treatment: “Small” classes (13-17 kids). • Control #1: “Regular” classes (22-25) without a teacher’s aide. • Control #2: “Regular” classes (22-25) with a teacher’s aide. Each supports interesting post-hoc empirical comparisons, using GLH Testing You can include more than two groupsin the research design S290: Quantitative Methods for Improving Causal Inference in Educational ResearchAppendix II: Randomized Experiments Need Not Simply Be Two-Group Comparisons …
You can makethetreatment levelsordinalorcontinuous • Modeling Across the Curriculum(MAC) Project • (Concord Consortium, 2004) • Computer-aided learning -- learners explore science concepts in structured simulations in high-school biology and chemistry. • Research Question: Does increased on-line guidance cause students to achieve at higher levels? • Outcome: Science achievement, measured on-line. • Experimental Conditions: • On-line guidance provided, with the level of guidance being manipulated continuously. • Assigned randomly to student, by ID. • Treatment level entered as a continuous predictor into the data-analyses. S290: Quantitative Methods for Improving Causal Inference in Educational ResearchAppendix II: Randomized Experiments Need Not Simply Be Two-Group Comparisons … More statistical power than “categorical” treatment assignment.
You can make the treatment levelatime-varying predictor • Modeling Across the Curriculum(MAC) Project (Concord Consortium, 2004) • Computer-aided learning -- learners explore science concepts in guided simulations in high-school biology and chemistry. • Research Question: Does increased on-line guidance lead students to achieve at higher levels? • Outcome: Science achievement, measured at each log-on, via the interactive technology. • Experimental Conditions: • On-line guidance provided, with level of guidance being manipulated continuously. • Student randomly assigned a different level of individual guidance at each log-on. • Treatment level entered as a continuous time-varying predictor into the data-analyses. • Possible Extension of the Tennessee Student/Teacher Achievement Ratio (STAR) Experiment (Krueger, 1999) • Research Question: Is academic achievement enhanced when students are taught in smaller classes? • Outcome: Student Achievement. • Experimental Conditions: • Could have reassigned students exogenously to different sized classes in different years. • Solves an ethical issue? • Analysis: Modeled the relationship between individual outcome and the longitudinal class size profiles over time. S290: Quantitative Methods for Improving Causal Inference in Educational ResearchAppendix II: Randomized Experiments Need Not Simply Be Two-Group Comparisons … More statistical power, richer research questions
Howell, W.G, Wolf, P. J., Campbell, D. E., & Peterson, P. E. (2002). School Vouchers And Academic Performance: Results From Three Randomized Field Trials. Journal of Policy Analysis and Management, 21(2), 191-217. • The authors report on a classical two-group randomized experimental design. • Their regression analyses of the experimental data include covariates, but their comments about why the covariates were included are not entirely correct. • The paper distinguishes the effect of Intent to Treat from the effect of Treatment, a distinction that is worth paying attention to, and that will feature repeatedly in the course. • In fact, in follow-up analyses, the authors use the voucher offer as an instrumental variable to estimate the unbiased causal effect of private school. We will talk about this later. • There is attrition from the sample between kindergarten and fourth grade that the authors attempt to adjust for, using empirically estimated post-hoc “probability” weights. Did they get the weights right? Do they adequately reflect the attrition? S290: Quantitative Methods for Improving Causal Inference in Educational ResearchAppendix III: Selected Comments On Next Week’s Reading