Download
1 / 32
320 likes | 490 Views
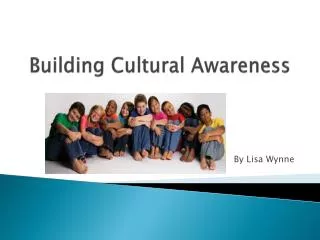
The Power of Cultural Awareness. Catharina Gräbe. Culture. Gender Race Ethnicity Age Traditions Abilities Socioeconomic status. Why should teachers understand cultural differences?. The Importance of Diversity. “The Race Connection” by Dr. Thomas S. Dee of Stanford University

E N D
The Power of Cultural Awareness Catharina Gräbe
Culture Gender Race Ethnicity Age Traditions Abilities Socioeconomic status (Kaplan & Owings, 2011, p. 375)
Why should teachers understand cultural differences? Source: "Creating a Multicultural Classroom Environment" by Foram Mehta (2011, October 6), Retrieved from http://www.buzzle.com/articles/creating-a-multicultural-classroom-environment.html
The Importance of Diversity “The Race Connection” by Dr. Thomas S. Dee of Stanford University Examining influence of teacher’s cultural background on student learning: Tennessee randomized field trial that began in 1985 (Dee, 2004)
Project STAR Project STAR (Student Teacher Achievement Ratio) Effect of class size on student learning Placed students and teachers together randomly 11,600 students in 79 schools Kindergarten up to 3rd grade Math: 23, 883 observations Reading: 23, 544 observations (Dee, 2004, pp. 55-56)
Results • Black teacher with black students • Math scores: 3 to 5% increase • Reading scores: 3 to 6% increase • White teacher with white students • Math scores: 4 to 5% increase • Reading scores for girls: no detectable difference • Reading scores for boys: 2 to 6% increase (Dee, 2004, p. 57)
Can you think of possible reasons that explain the research results?In your experience, do students learn better from teachers who understand different cultures?
Hispanic - ethnicity within white racial group Hampton Roads: 4.0% United States: 15.1% Note. Adapted from "Population Distribution by Race in Hampton Roads" in Virginia's Hampton Roads Regional Profile by Hampton Roads Partnership and Hampton Roads Planning District Commission, January 2009, p. 4. Retrieved from http://www.hrp.org/Site/docs/ResourceLibrary/HR_Performs_Regional_Profile_FINAL_01-30-09.pdf
Hampton Roads Teacher-Student Demographics http://hamptonroads.com/2011/09/datapilot-local-teacherstudent-demographics
“Teacher-student racial imbalance widest in Virginia Beach” by Mike Hixenbaugh Across VA: 43% of students, 17% of teachers are minorities In Virginia Beach: lack of cultural diversity among teachers Too few black and Hispanic teachers Few men teach in Virginia Beach (one in five teachers) (Hixenbaugh, 2011)
Racial Imbalance in Virginia Beach "Candid Conversations about Race" Professional development program 2008 Virginia college graduates in education: 3,100 graduates, 225 black Across the U.S.: less than 8% of teachers are black (Hixenbaugh, 2011)
Teacher and Student Cultural Differences http://youtu.be/tfa7VWxtS7k (Heinemann Publishing, n.d.)
How can a teacher’s cultural awareness help students in the classroom?
Hampton Roads Demographics Non-Hispanic White: 61.7% Black: 32.5% Hispanic: 4.0% Asian: 3.1% Note. Adapted from "Population Distribution by Race in Hampton Roads" in Virginia's Hampton Roads Regional Profile by Hampton Roads Partnership and Hampton Roads Planning District Commission, January 2009, p. 4. Retrieved from http://www.hrp.org/Site/docs/ResourceLibrary/HR_Performs_Regional_Profile_FINAL_01-30-09.pdf
Source: From cradle to career: Connecting American education from birth through childhood. (2007, January 4). Quality Counts 2007, Education Week, 26(17), p. 8. Retrieved from http://www.edweek.org/media/ew/qc/2007/QC07_PressConference_Remarks.pdf
Single-Parent Families in the United States Data for 2011 Black: 67% Hispanic: 42% Non-Hispanic White: 25% Asian: 17% (Children, 2014)
Source: "US Race Household Income" by BrendelSignature, Wikipedia. Retrieved from http://en.wikipedia.org/wiki/File:US_Race_Household_Income.png
Non-Hispanic White Colonies: British and French, Germans and Dutch 2011: less than 50% of children born in U.S. Immigration has declined Increased intermarriage 78.4% of Americans identify themselves as Christian (Report 1, 2013) (Non-Hispanic, n.d.)
African-American History • 1500 to 1860s: 12 million African slaves brought to North and South America • mainly to South American and Caribbean • 500, 000 slaves sent to North America • 1865 Slavery abolished in United States (Gates, n.d.)
African-American Culture • Graduation from high school • 1960: 20% • 2007: 82.3% • College Graduation • 1960: 3% • 2007: 18.5% • Life expectancy • 1900: 34 years old • 2008: 73 years old • Annual Median Income in 2007: $33, 916 (Kaplan & Owings, 2011, p. 393)
African-American Culture Family values Extended family may live together Community help one another to raise children Value spiritual beliefs and involvement in religious activities Men and women share family roles Value education (Kaplan & Owings, 2011, pp. 393-394)
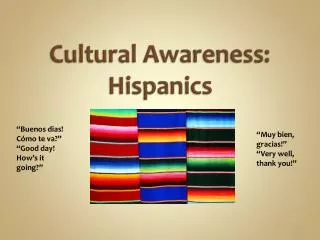
Hispanic American History Have faced discrimination in education 1848 South-West Mexican territories 1898 Spanish-American War – Puerto Rico Predominantly Mexican, Puerto Rican, and Cuban (Kaplan & Owings, 2011, pp. 394-395)
Hispanic Students Family values: loyalty and cooperation Traditional family roles Community of family and friends (social networking) Catholicism Value education Possible language barrier (Kaplan & Owings, 2011, pp. 394-395)
Asian American History 1840’s: immigration of Chinese and other Asian national groups to U.S. to find work Persecution, denied citizenship World War II: internment camps Own communities (Information, 2014)
Asian American Culture Buddhism, Confucianism, Taoism Value harmony, do not want to engage in arguments Hierarchical family structure (Information, 2014)
Asian American Culture Strong work ethic Focused on education Structured family roles Non-verbal communication Possible language barrier (Chen, 2005)
The Gender Gap 1970s and 1980s - girls did not score as well academically as boys, especially in math and science Recent years: girls scored better than boys in school More women than men graduate from college Men attain better scores on standardized tests More men than women work in STEM fields (Achievement, n.d., Gender achievement)
Source: "Differences in Average Scale Scores for Girls and Boys" by the U.S. Department of Education, National Assessment of Educational Progress. Retrieved from http://en.wikipedia.org/wiki/File:Differences_in_Average_Scale_Scores_for_Girls_and_Boys.jpg
The Gender Gap • 2007 Census (Achievement, n.d., Gender gap in graduation) • Bachelor’s degrees: 20,501,000 women, 18,423,000 men • Over time: more women than men graduating from high school since 1970s (Murnane & Hoffman, 2013)
Which cultural groups do you identify with? As a teacher, how could you use your knowledge of different cultures to facilitate learning?
References Achievement gap in the United States. (n.d.). Wikipedia. Retrieved March 22, 2014, from http://en.wikipedia.org/wiki/Achievement_gap_in_the_United_States#Gender_achievement_gap_in_the_United_States Chen, H. J. (2005, February 14). Asian Americans and Their Culture. Personal Collection of H. J. Chen, University of South Florida Louis de la Parte Florida Mental Health Institute, Tampa, FL. Retrieved from http://www.emfp.org/DocVault/ContributionstoScience/AsianAmericanandTheirCulture.aspx Children in single-parent families by race. (2014). The Annie E. Casey Foundation. Retrieved from http://datacenter.kidscount.org/data/tables/107-children-in-single-parent-families-by#detailed/1/any/false/868,867,133,38,35/10,168,9,12,1,13,185,11|/432,431 Dee, T. S. (2004, Spring). The race connection. Education Next, 52-59. Retrieved from http://media.hoover.org/sites/default/files/documents/ednext20042_52.pdf Gates, H. L., Jr. (n. d.). The African Americans: Many rivers to cross. Retrieved from http://www.pbs.org/wnet/african-americans-many-rivers-to-cross/history/on-african-american-migrations/ Hampton Roads Partnership & Hampton Roads Planning District Commission. (2009, January). Virginia's Hampton Roads Regional Profile. Retrieved from http://www.hrp.org/Site/docs/ResourceLibrary/HR_Performs_Regional_Profile_FINAL_01-30-09.pdf
References (continued) Heinemann Publishing. (n.d.). Culturally Responsive Teaching. [Video file]. Video posted to http://youtu.be/tfa7VWxtS7k Hixenbaugh, M. (2011, September 17). Teacher-student racial imbalance widest in Va. Beach. The Virginian-Pilot. Retrieved from http://hamptonroads.com/2011/09/teacherstudent-racial-imbalance-widest-va-beach Information on specific cultural groups. (2014). Brigham Young University David O. McKay School of Education. Retrieved from http://education.byu.edu/diversity/culture.html Kaplan, L. S., & Owings, W. A. (2011). American education: Building a common foundation. Belmont, CA: Wadsworth, Cengage Learning. Murnane, R. J., & Hoffman, S. (2013, Fall). Graduations on the rise. Education Next, 13(4). Retrieved from http://educationnext.org/graduations-on-the-rise/ Non-Hispanic Whites. (n.d.). Wikipedia. Retrieved March 22, 2014, from http://en.wikipedia.org/wiki/Non-Hispanic_Whites Report 1: Religious Affiliation. (2013). The Pew Research Center. Retrieved from http://religions.pewforum.org/reports