Download
1 / 29
310 likes | 427 Views
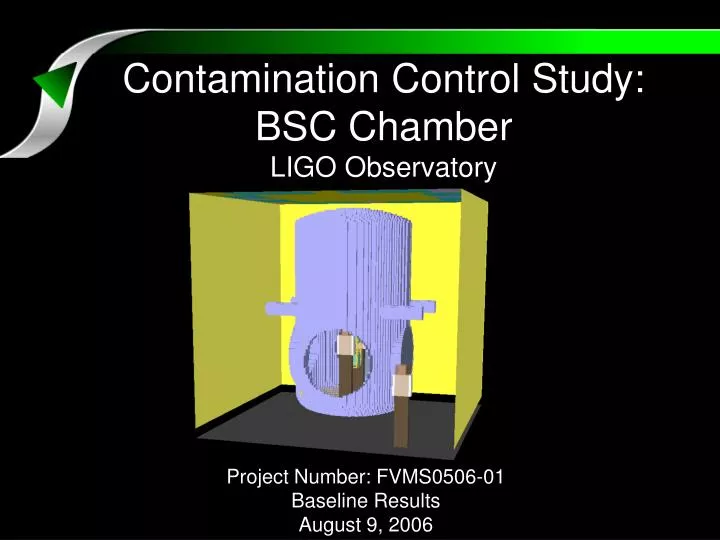
Contamination Control Study: BSC Chamber LIGO Observatory. Project Number: FVMS0506-01 Baseline Results August 9, 2006. Objectives.

E N D
Contamination Control Study:BSC ChamberLIGO Observatory Project Number: FVMS0506-01 Baseline Results August 9, 2006
Objectives • Create a thermal/airflow FLOVENT model of the BSC Chamber and surrounding Cleanroom to determine airflow patterns and contamination concentration with respect to the following scenarios: • Scenario 1: • BSC Chamber Air Supply/Extract: OFF • Surrounding Clean Room Space Air Supply: ON • Scenario 2: • BSC Chamber Air Supply: ON • Surrounding Clean Room Space Air Supply: ON
Personnel Assumptions • Personnel: • 4 personnel: 2 in BSC Chamber, 2 in surrounding cleanroom • Contamination Generation rate: 3950 particles/sec (≥ 0.5um) • Heat Generation rate: 85 W sensible heat Uniform heat and particle generation Contamination rate based on: high quality cleanroom clothing systems at 25 washes and moderate personnel activity (Cleanroom Clothing Systems: People as a Contamination Source, Ljungqvist and Reinmuller)
Personnel Locations Only open door Purge Airflow
Cleanroom Overview HEPA Filters: 400 cfm (0.188 m3/s) each, QTY: 20 17.33’ Curtain opening: 8.5” height 18.58’ 17.42’ HEPA Filters outlined in red
BSC Airflow Overview Purge Airflow: 0.012 m3/s (25 cfm) Flow direction Extract Flow: 2.8 m3/s (scenario 2) Flow direction Perforated Floor:20% Open
Air Shower Overview Annular Flow: 2.0 m3/s (scenario 2) No Flow Area (Support rod hidden for clarity) Core Flow: 1.0 m3/s (scenario 2) Core Flow and Annular Flow approximated with flow accelerated through 3/8” holes on 1” pitch (11% Open)
Simulation Results BSC Chamber Air Supply and Extract Off
z x y Speed Profile through the Chamber Door Maximum Outward Flow Maximum Inward Flow The above table show a net airflow through the chamber of 0.0118m3/sec. However there is also an extra 0.0353 m3/sec air exchange at the open door. Plane taken at the cross-section of the chamber door
View Orientation Room Airflow Profile Plane taken at centerline of the room
View Orientation Room Airflow Profile Heated air exhausting from the chamber has a strong effect on the airflow patterns of the room Plane taken at centerline of the room
View Orientation Chamber Airflow Profile Plane taken at centerline of the chamber
View Orientation Chamber Airflow Profile We see that when the supply and exhaust in the chamber are turned off natural convection caused by the workers dominates the airflow patterns Plane taken at centerline of the chamber
ISO Class Specifications 0.5 um diameter particles Maximum concentration:1,642,731 Particles/m3 (ISO 8) The following slides show the areas of the space at various uniform concentration levels.
ISO 7 ISO 6 ISO 5 ISO 4 Area of open door ISO Class 5
ISO 7 ISO 6 ISO 5 ISO 4 ISO Class 6
ISO 7 ISO 6 ISO 5 ISO 4 ISO Class 7 Location of maximum concentration Area of open door Chamber doors hidden for visualization purposes
Simulation Results BSC Chamber Air Supply and Extract On
View Orientation Chamber Airflow Profile Plane taken at centerline of the chamber
View Orientation Chamber Airflow Profile Plane taken at centerline of the chamber
View Orientation Room Airflow Profile Plane taken at centerline of the chamber
View Orientation Room Airflow Profile Plane taken at centerline of the chamber
Flow Path to Extraction Tube The picture on the right shows streamline paths from the core and annular flow areas to the extraction tube. Note that a small amount of air is flowing into the chamber though the top of the chamber door.
z x y Speed Profile through the Chamber Door Maximum Outward Flow Maximum Inward Flow Plane taken at the cross-section of the chamber door
Extraction Pressure The above plane shows pressures ranging from -900 Pa to -3700 Pa The above plane is taken at the inlet to the extraction nozzle, and illustrates the pressure required to achieve a flow of 2.8 m3/sec and assumes the nozzle is venting to atmosphere
ISO Class Specifications 0.5 um diameter particles Maximum concentration: 199,055 Particles/m3 (ISO 7) The following slides show the areas of the space at various uniform concentration levels.
ISO 7 ISO 6 ISO 5 ISO 4 ISO Class 5 Chamber doors hidden for visualization purposes
ISO 7 ISO 6 ISO 5 ISO 4 ISO Class 6 Location of maximum concentration
Summary • A thermal/airflow FLOVENT model of the BSC Chamber and surrounding Cleanroom has been created and simulated to determine airflow patterns and contamination concentration with respect to the following scenarios: • Scenario 1: • BSC Chamber Air Supply/Extract: OFF • Surrounding Clean Room Space Air Supply: ON • Maximum Concentration: 1,642,731 particles/m3 • BSC Chamber open door in-flow: 0.04 m3/sec • Scenario 2: • BSC Chamber Air Supply: ON • Surrounding Clean Room Space Air Supply: ON • Maximum Concentration: 199,055 particles/m3 • BSC Chamber open door in-flow: 0.16 m3/sec