Download
1 / 23
230 likes | 402 Views
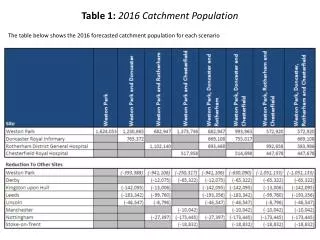
ALSO SEE WORKBOOK, PG 248. 1. POPULATION. 1.1 WHERE DO MOST PEOPLE IN THE WORLD LIVE?. 1.2 Demographic change. World p opulation today. Over 50% urban. World population today. Over 50% urban. 1.3. The rural exodus & urbanization Textbook, pg 58.

E N D
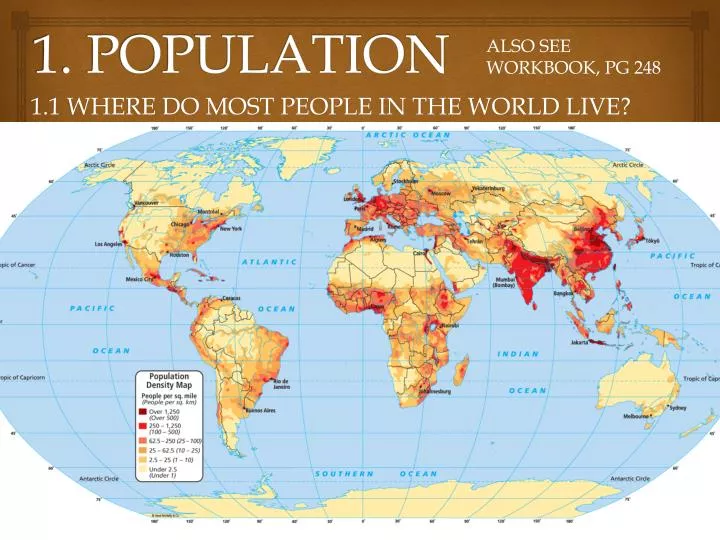
ALSO SEE WORKBOOK, PG 248 1. POPULATION 1.1 WHERE DO MOST PEOPLE IN THE WORLD LIVE?
1.2 Demographic change World population today • Over 50% urban.
World population today • Over 50% urban.
1.3 The rural exodus & urbanizationTextbook, pg 58 • “The progressive mechanization of agriculture in the 19th century decreases the need for field workers. Unemployed farm workers start trying their luck in the cities, working in new industries. These internal migrations from the countryside to the cities mark the beginning of urbanization. Around 1800, only 3% of the planet’s inhabitants lived in cities. By 1900, it jumped to 15% and by 2008: 50% • This trend continues today”
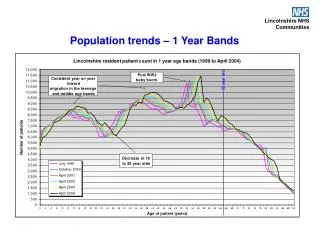
1.4 Main demographic characteristics of less-developed countries TXT: pg 78-79 • Falling death rate • Falling fertility rate • Rising life expectancy • Stabilization of growth • Increasing international migration
1.5 Main demographic characteristics of developed countries TXT: pg 78-79 • Falling birth rate • Population aging • Increasing international immigration “In developed countries, there are ever fewer workers to pay for the pensions and medical care of aging people, whose numbers are growing. Also, developed countries may find themselves with too few workers in many sectors of their economy. To deal with these problems, they encourage replacement migration; that is, the immigration of people of working age”
1.6 So what explains thepopulation growth? & What contributes to it? • Improvement of health care. • Increase in food and resource production. • Adoption of natalist policies. • Adoption of measures facilitating immigration.
1.7 What is Replacement Level? What is Fertility Rate? • When newborn generations are enough to replace the older generations that die out. • Average number of children born to a country’s woman during her full reproductive life. So when Fertility Rate is LOWER than Replacement Level… • There is negative rate of natural increase
2. URBANIZATION > 50% 2.1 RECAP: SINCE 2008, THE PROPORTION OF WORLD POPULATION LIVING IN CITIES IS…
2.2 Urban growth • NYC, 1930s • NYC, 18th century • MIGRATION: MAIN URBAN GROWTH FACTOR • Txt: 98-99
2.3 Internal Migration in less developed countries: -> Shanty towns • Example: Buenos Aires, Argentina
2.3 Internal Migration in less developed countries: -> Shanty towns • Example: Buenos Aires, Argentina
2.3 Internal Migration in less developed countries: -> Shanty towns 2.4 • Example: Buenos Aires, Argentina SHANTYTOWNS: . On the outskirts of large cities. . Inadequate health infrastructure . Most land occupied by squatters. TXT: pg 100 - 101
2.3 Internal Migration in less developed countries: -> Shanty towns 2.4 • Example: Favela in Sao Paulo, Brazil SHANTYTOWNS: . On the outskirts of large cities. . Inadequate health infrastructure . Most land occupied by squatters. TXT: pg 100 - 101
2.5: Why do immigrants choose cities as destinations? • JOB POSSIBILITIES • MORE HEALTH AND EDUCATION SERVICES • RECEPTION STRUCTURES • PRESENCE OF A DIASPORA
2.6: Characteristics of districts populated mostly by immigrants • ECONOMICALLY DISADVANTAGED Parc Extension, Montreal
2.6: Characteristics of districts populated mostly by immigrants • CONCENTRATION OF CULTURAL MINORITIES Gerrard Street, Toronto
2.6: Characteristics of districts populated mostly by immigrants • FORMATION OF ETHNIC NEIGHBOURHOODS Chinatown, Montreal
3. Migration 3.1 RECAP: TYPES OF MIGRATION: INTERNAL: Within a country EXTERNAL: From one country to another
3.2: General characteristics of migrants • Mainly young • Mainly from less-developed countries • Generally men • Of working age Textbook: Pg. 69
3.3: World Migration Flows • Let’s look at the maps on: • TEXTBOOK: Pgs. 74-75 • & WORKBOOK: Pg. 66 What do we observe?
3.4: What explains increase in world migration? • Development of transportation and communications infrastructure (TXT 72-73) • Economic globalization (TXT 86-87) • Climate change (TXT 83) • Political problems (80-81)
3.5: Factors that influence the choice of host country • Geographical proximity (choosing a new country that is close by) • Diaspora (TXT 96-97) • Colonial ties • Cultural characteristics (example: language, religion, worldview) LET’S ANSWER QUESTION 7 on WORKBOOK, pg. 71