Download
1 / 37
370 likes | 503 Views
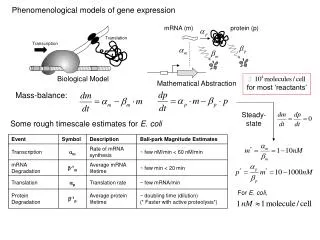
Rich Probabilistic Models for Gene Expression. Eran Segal (Stanford) Ben Taskar (Stanford) Audrey Gasch (Berkeley) Nir Friedman (Hebrew University) Daphne Koller (Stanford). Our Goals. Find patterns in gene expression data. j. i. A ij - mRNA level of gene i in experiment j.

E N D
Rich Probabilistic Models for Gene Expression Eran Segal (Stanford) Ben Taskar (Stanford) Audrey Gasch (Berkeley) Nir Friedman (Hebrew University) Daphne Koller (Stanford)
Our Goals • Find patterns in gene expression data
j i Aij - mRNA level of gene i in experiment j Data Organization Experiments Induced Genes Repressed
Standard Clustering Organization Experiments Genes
UndetectedSimilarity Bi-Clustering Organization Experiments Genes
Desired Organization Detect similarities over subsets of genes and experiments Note: rows and columns no longer correspond to genes and experiments
ACGCCTA Clinical information Experimental Details Annotations(GO, MIPS, YPD) Incorporate Heterogeneous Data • Find correlations directly • Focus on novel discoveries
LEARNER Gene Cluster Exp. type GCN4 HSF Lipid Exp. cluster Endoplasmatic Level hypotheses Our Approach ACGCCTA Clinical information Experimental Details Annotations(GO, MIPS, YPD)
Probabilistic Relational Models(Koller & Pfeffer 98; Friedman,Getoor,Koller & Pfeffer 99) Gene Experiment Gene Cluster Exp. cluster Level Expression
+ Exp. Cluster2 Exp. Cluster1 Gene Cluster1 Level1,2 Level1,1 Gene Cluster2 Level2,1 Level2,2 Gene Cluster3 Level3,1 Level3,2 Resulting Bayesian Network Gene Experiment Gene Cluster Exp. cluster Level Expression
CPD GCluster ECluster P(Level) P(Level) 1 1 0.8 1.2 1 2 -0.7 0.6 … Level Level -0.7 0.8 Probabilistic Relational Models Gene Experiment Gene Cluster Exp. cluster Level Expression
GCN4 Exp. type HSF Lipid Endoplasmatic • Annotations • Binding sites • Experimental details Adding Heterogeneous Data Gene Experiment Gene Cluster Exp. cluster Level Expression
ACGCCTA + Experimental Details Annotations(GO, MIPS, YPD) Exp. type1 Exp. type2 Gene Cluster1 GCN41 Exp. cluster1 Exp. cluster2 HSF1 Level1,1 Level1,2 Lipid1 Endoplasmatic1 Gene Cluster2 GCN42 HSF2 Lipid2 Level2,1 Level2,2 Endoplasmatic2 Gene Cluster3 GCN43 HSF3 Level3,1 Level3,2 Lipid3 Endoplasmatic3 Resulting Bayesian Network Gene Experiment Gene Cluster Exp. type GCN4 HSF Lipid Exp. cluster Endoplasmatic Level Expression
GC LP END HSF EC TYP 6 parents 26 cases k parents 2k cases! 1 No No No 1 1 0.8 1.2 1 No No No 1 2 0.7 0.6 … Problem: Exponential Blowup Gene Experiment Gene Cluster GCN4 Exp. type HSF Lipid Exp. cluster Endoplasmatic Level Expression
Gene Experiment DNA repair UV Light DNA Damage Level DNA repair genes transcribed Expression 0 0 UV = Yes UV = No Repair = Yes Repair = No Repair = Yes Repair = No 0 0 Solution: Context Specificity Ultra Violet Light
0 0 0 0 0 0 0 0 Solution: Context Specificity Gene Ultra Violet Light Experiment DNA repair UV Light DNA Damage Level DNA repair genes transcribed Expression UV = Yes UV = No
UV = Yes true false 0 Repair = Yes 0 0 true false 0 Solution: Context Specificity Gene Ultra Violet Light Experiment DNA repair UV Light DNA Damage Level DNA repair genes transcribed Expression
Exp. Cluster = 2 true false Lipid = Yes HSF= Yes true false true false GCN4 = Yes GCN4 = Yes P(Level) . . . P(Level) true false true false Level 2 P(Level) P(Level) . . . Level -3 Level Level 3 0 Modeling Context Specificity Gene Experiment Gene Cluster Exp. type GCN4 HSF Lipid Endoplasmatic Exp. cluster Level Expression Grouping = a leaf in the tree
Gene Experiment Gene Cluster Exp. type GCN4 HSF Lipid Exp. cluster Endoplasmatic Level Expression Exp. Cluster = 2 GC EC Lipid = Yes HSF= Yes 1 1 0.8 1.2 1 2 -0.7 0.6 2 1 0.8 1.2 2 2 -0.7 0.6 GCN4 = Yes GCN4 = Yes . . . . . . … … . . . . . . . . . . . . Learning the Models LEARNER ACGCCTA Experimental Details Annotations(GO, MIPS, YPD)
Bayesian score • Heuristic search • Expectation Maximization (EM) Learning Algorithm Automatic Induction • Structure Learning: • Dependency structure • Tree structure • Missing Data: • Gene cluster & experiment cluster never observed
Learning Process Gene Experiment Gene Cluster GCN4 Exp. type HSF Lipid Exp. cluster Endoplasmatic Level Expression
Learning Process Experiment Similarity Gene Experiment Gene Cluster GCN4 Exp. type HSF Lipid Exp. cluster Endoplasmatic Level Expression Exp. Cluster = 2
Learning Process Gene Similarity Gene Experiment Gene Cluster GCN4 Exp. type HSF Lipid Exp. cluster Endoplasmatic Level Expression Exp. Cluster = 2 Gene Cluster = Yes
Learning Process Separability by binding site Gene Experiment Gene Cluster GCN4 Exp. type HSF Lipid Exp. cluster Endoplasmatic Level Expression Exp. Cluster = 2 Gene Cluster = Yes HSF= Yes . . . . . .
Learning Process Attribute dependencies: induce cluster changes Gene Experiment Gene Cluster GCN4 Exp. type HSF Lipid Exp. cluster Endoplasmatic Level Expression Exp. Cluster = 2 Gene Cluster = Yes HSF= Yes . . . . . .
Learning Process Achieved desired clustering Gene Experiment Gene Cluster GCN4 Exp. type HSF Lipid Exp. cluster Endoplasmatic Level Expression Exp. Cluster = 2 Gene Cluster = Yes HSF= Yes GCN4 = Yes GCN4 = Yes . . . . . . . . . . . . . . . . . .
Yeast Stress Data (Gasch et al 2001) • Measured response to stress cond. • 92 arrays • We selected ~900 genes • Added data: TRANSFAC, MIPS Results: • 15 significant TFs • 7 significant function categories • 793 Groupings
Down in nitrogen depletion • Transporter genes • Metabolism of amino acids Context Specific Groupings
Up in Starvation, Nitrogen depletion & DTT • Transporter genes • Metabolism of nitrogen Context Specific Groupings
Example Biological Finding • Discovered grouping of 17 genes • All induced in diauxic shift • All have 2 binding sites for MIG1 transcription factor • Many not known to be regulated by MIG1 • Context-sensitive groupings were key to finding cluster
GCluster (of mutated gene) Lipid (of mutated gene) Compendium Data (Hughes et al 2000) • 300 samples of yeast deletion mutants Gene Array/Mutated Gene GCluster GCN4 HSF Lipid ACluster Endoplasmatic Expression Level
Resulting Bayesian Network Gene 1 mutant Gene 3 mutant Gene 1 Lipid1 Lipid3 Gene Cluster1 Array. cluster1 Array. cluster3 HSF1 Gene 2 Level1,1 Level1,2 Gene Cluster2 HSF2 Level2,1 Level2,2 Gene 3 Gene Cluster3 HSF3 Gene 4 Level3,1 Level3,2 Gene Cluster4 HSF4 Level3,1 Level3,2
Example: predicting the effect of mutating gene 4 Gene 4 mutant • Available information: • Attributes of gene 4 • Gene Cluster of gene 4 as a gene Lipid4 ? Array. cluster ? Gene Cluster4 HSF4 Experimental Setup • Goal: predict the effect of mutating specific genes without performing the experiment (!)
Experimental Setup Gene 1 mutant Gene 3 mutant Gene 4 mutant Lipid1 Lipid3 Lipid4 Gene Cluster1 ? Array. cluster1 Array. cluster3 Array. cluster HSF1 Level1,1 Level1,2 Gene Cluster2 ? HSF2 Level2,1 Level2,2 Gene Cluster3 HSF3 Level3,1 Level3,2 Gene Cluster4 HSF4 Level3,1 Level3,2
Training set: 180 mutants Test set:20 mutants Gene Cluster Exp. type GCN4 HSF Lipid Exp. cluster Endoplasmatic 95% accuracy Level 100 90 • 44 arrays predicted at 99% confidence and 95% accuracy • Relational model is key to prediction 80 70 60 Accuracy (%) 50 40 30 20 10 0 PRMs Results
Conclusions • Presented a unified probabilistic framework: • Models complex biological domains • Expressive data organization • Incorporates heterogeneous data • Future directions: • Incorporate DNA and protein sequence data • Discover regulatory networks Thank You! • Paper: http://www.cs.stanford.edu/~eran • Software (soon): http://dags.stanford.edu/bio • Contact: eran@cs.stanford.edu