Download
1 / 20
210 likes | 226 Views
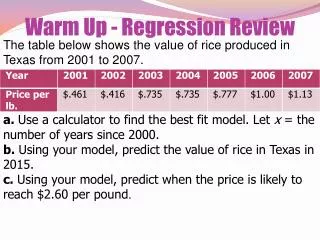
Regression Review. Population Vs. Sample Regression Line Residual and Standard Error of Regression Interpretation of intercept & slope T-test, F-test and Coefficient of determination Non-normality of error, Multicollinearity, Heteroscedasticity and Autocorrelation

E N D
Regression Review • Population Vs. Sample Regression Line • Residual and Standard Error of Regression • Interpretation of intercept & slope • T-test, F-test and Coefficient of determination • Non-normality of error, Multicollinearity, Heteroscedasticity and Autocorrelation • Dummy variables & Non-linear relationships
Population Vs. Sample Regression y = b0 + b1x1+ b2x2 + …+ bkxk + e The population regression line is said to be the true relationship between the X’s and Y. It cannot be observed due to the size of the population and the presence of the random error term
Sample Regression line y = b0+ b1x1+ b2x2 + …+ bkxk + e b0 is an OLS estimator of b0 b1 is an OLS estimator of b1 Based on fitting the line to the sample of data e is the residual. It is our best guess of ewhich is unobservable. It is the vertical distance of a sample data point from the regression line.
Residual and Standard Error of Regression The smaller the standard deviation of e (also called the Standard Error of the Regression) the better the line fits the data. It is given by the formula
Predicted Value of Y = b0+ b1x1+ b2x2 + …+ bkxk Is the predicted value of Y obtained by multipying the data values of X by the sample regression coefficients
Slope & Intercept • The slope bo of the sample regression equation is the value of Y when all the X’s are 0. In other words it is the impact of some variable (other than the X’s) on the Y variable. • The slope of any X variable bi is the value that Y changes by when Xi changes by 1 unit.
H0: bi = 0 H1: bi = 0 T-test • The t-test tests the hypothesis that a given Xi does not influence Y at all. If we can reject the null hypothesis then we can conclude that Xi does have an effect on Y and thus belongs in the regression equation.
T-test • We can reject the null hypothesis at a given significance level (usually 5%) if the value of the calculated t-stat in absolute value is greater than the critical value of the t-stat taken from the table (usually 1.96). d.f. = n - k -1
F-test • The F-test checks to see whether the model as a whole (all the X’s) do anything to explain the movement of Y around its mean value. If the value of the calculated F-stat is greater than the value of the critical F-stat from the table we reject the null hypothesis that none of the X’s belong in the model. H0: b1 = b2 = … = bk = 0 H1: At least one bi is not equal to zero.
SSR/k = F SSE/n-k-1 F-test • The calculated F-stat is given by • The critical F-state is given by F>Fa,k,n-k-1
Coefficient of Determination • The R-Square of coefficient of determination gives the percentage of variation of Y around its mean that can be explained by all the X’s. • Low R-squares usually mean that the line does not fit the data very well and that the model may not be very good at explaining changes in Y based on the X’s.
Non-normality of Error • If the assumption that e is distributed normally is called into question we cannot use any of the t-test, F-tests or R-square because these tests are based on the assumption that e is distributed normally. The results of these tests become meaningless.
Non-normality of Error • Check for normality by computing the JB stat. Normality is preserved is JB stat is less than 5.99. • If normality is a problem try a transformation of the Y-variable such as Log(y), 1/Y etc.
Multicollinearity • When two or more X’s are correlated you have multicollinearity. • Symptoms of multicollinearity include insignificant t-stats (due to inflated standard errors of coefficients) and a good R-square. • Test: Run a correlation matrix of all X variables. • Fix: More data, combine variables.
Heteroscedasticity • When the variance of the error term is different for different values of X you have heteroscedasticity. • Test: Plot Residual (On vertical axis) Vs. Predicted Y-values (Horizontal axis). Presence of a cone shape plot indicates heteroscedasticity. • Problem: The OLS estimators for the’s are no longer minimum variance. You can no longer be sure that the value you get for bi a lies close to the true i. • Fix: White correction for standard errors.
Autocorrelation/ Serial Correlation • When the error term from one time period is related to the error term from the previous time period you have first order auotocorrelation. • Test: Durbin Watson test. • Problem: The standard errors of the coefficients are wrong so the t-tests are unreliable. • Fix: Include time as a variable.
Dummy Variables • Sometimes X’s are categorical male/female, smoker/non-smoker etc. These can be modelled using variables that take on a zero or one value. • Remember to always have one dummy variable less than the number of categories you are modelling. Why?
Non-linear Realtionships • You may believe that X and X square both influence Y. OLS can still be used. Generate a new variable for X-square by multipying X by itself and include both X and X square in the regression. Interpretation of coefficients?