Download
1 / 24
240 likes | 251 Views
Insight from the A-Train into Global Air Quality. Randall Martin, Dalhousie and Harvard-Smithsonian Aaron van Donkelaar, Lok Lamsal, Akhila Padmanabhan, Dalhousie University Chulkyu Lee, Dalhousie National Institute of Meteorological Research, Korea with contributions from

E N D
Insight from the A-Train into Global Air Quality Randall Martin, Dalhousie and Harvard-Smithsonian Aaron van Donkelaar, Lok Lamsal, Akhila Padmanabhan, Dalhousie University Chulkyu Lee, Dalhousie National Institute of Meteorological Research, Korea with contributions from Rob Levy, Ralph Kahn, Nick Krotkov, NASA Mark Parrington, Dylan Jones, University of Toronto OMI NO2 Team A-Train Symposium, New Orleans October 26, 2010
Two Applications of Satellite Observations for Air Quality (AQHI) Estimating Surface Concentrations (large regions w/o ground-based obs) Key pollutants: PM2.5, O3, NO2 Smog Alert PM2.5 : fine aerosol Top-down Constraints on Emissions (to improve AQ simulations)
Column Observations of Aerosol and NO2 Strongly Influenced by Boundary Layer Concentrations Weak Thermal Contrast Strong Rayleigh Scattering Aerosol O3 NO2 O3 9.6 2.2 4.7 0.52 0.62 0.75 0.30 0.36 0.43 Wavelength (μm) Vertical Profile Affects Boundary-Layer Information in Satellite Obs Normalized GEOS-Chem Summer Mean Profiles over North America O3 Aerosol Extinction S(z) = shape factor C(z) = concentration Ω = column NO2 Martin, AE, 2008
Temporal Correlation of AOD vs In Situ PM2.5 Correlation over Aug-Oct 2010
Combined AOD from MODIS (and MISR) for 2004-2008Rejected Retrievals over Land Types with Monthly Error vs AERONET >0.1 or 20% Spatial Correlation (r) of AOD vs in situ PM2.5 for North America MODIS: r = 0.39 MISR: r = 0.39 Simple Average: r = 0.44 Combined: r = 0.61 van Donkelaar et al., EHP, 2010
Chemical Transport Model (GEOS-Chem) Simulation of Aerosol Optical Depth Aaron van Donkelaar
Ground-level “dry” PM2.5 = η· AOD η affected by vertical structure, aerosol properties, relative humidity Obtain η from aerosol-oxidant model (GEOS-Chem) sampled coincidently with satellite obs GEOS-Chem Simulation of η for 2004-2008 van Donkelaar et al., EHP, 2010
Model (GC) CALIPSO (CAL) Evaluate GEOS-Chem Vertical Profile with CALIPSO Observations Altitude [km] • Coincidently sample model and CALIPSO extinction profiles • Jun-Dec 2006 • Compare % within boundary layer van Donkelaar et al., EHP, 2010 Optical depth above altitude z Total column optical depth τ(z)/τ(z=0)
Global Climatology (2004-2008) of PM2.5 from MODIS (& MISR) AOD and GEOS-Chem AOD/PM2.5 Relationship Evaluation for US/Canada r=0.77 slope=1.07 n=1057 US EPA standard Evaluation with measurements outside Canada/US Better than in situ vs model (GEOS-Chem): r=0.52-0.62, slope = 0.63 – 0.71 van Donkelaar et al., EHP, 2010
WHO Guideline & Interim Targets Data Valuable to Assess Health Effects of PM2.5 AQG IT-3 IT-2 IT-1 100 90 80 70 60 50 40 30 20 10 0 • 80% of global population exceeds WHO guideline of 10 μg/m3 • 35% of East Asia exposed to >50 μg/m3 in annual mean • 0.61±0.20 years lost per 10 μg/m3 [Pope et al., 2009] • Estimate decreased life expectancy due to PM2.5 exposure Population [%] 5 10 15 25 35 50 100 PM2.5 Exposure [μg/m3] van Donkelaar et al., EHP, 2010
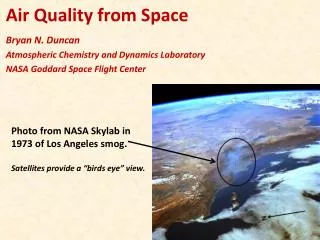
USA Today: Hundreds Dead from Heat, Smog, Wildfires in Moscow 9 Aug 2010: “Deaths in Moscow have doubled to an average of 700 people a day as the Russian capital is engulfed by poisonous smog from wildfires and a sweltering heat wave, a top health official said Monday.” MODIS/Aqua: 7 Aug 2010
PM2.5 Estimate from MODIS AOD and GEOS-Chem AOD/PM2.5 During Fires Before Fires Near Moscow MODIS-based In Situ Evaluation Near Moscow Regional Mean MODIS-based Estimate Aaron van Donkelaar
GEOS-Chem before assimilation GEOS-Chem after assimilation • The model underestimates surface ozone in the west Impact of TES Assimilation on Surface Ozone (Aug. 2006) Surface O3 difference (assim - no assim) AQS and NAPS surface O3 data Without assimilation the model underestimates background ozone by as much as 9 ppb (in western North America) Background O3 at the surface before assim. Background O3 at the surface after assim. • TES-based estimates of background O3 are 20-40 ppb [Parrington et al., GRL, 2009]
OMI Tropospheric NO2 Column Proxy for Surface Concentration NO/NO2 with altitude OMI Standard Product: October 2004 – September 2007 Inclusive
In Situ GEOS-Chem General Approach to Estimate Surface Concentration Coincident Model (GEOS-Chem) Profile Daily OMI Tropospheric Column • S→ Surface Concentration • Ω → Tropospheric column
Ground-Level NO2 Inferred From OMI for 2005 Spatial Correlation of Mean vs In Situ for North America = 0.78 Temporal Correlation with In Situ Over 2005 ×In situ —— OMI Lamsal et al., JGR, 2008
Application of Satellite Observations for Timely Updates to NOx Emission Inventories Use GEOS-Chem to Calculate Local Sensitivity of Changes in Trace Gas Column to Changes in Emissions Fractional Change in Emissions Fractional Change in Trace Gas Column Local sensitivity of column changes to emissions changes Apply to regions where anthropogenic emissions dominate (>50%) Walker et al., ACP, 2010 Lamsal et al., GRL, in prep
Forecast Inventory for 2009 Based on Bottom-up for 2006 and OMI NO2 for 2006-2009 9% increase in global emissions 21% increase in Asian emissions Lamsal et al., GRL, in prep
OMI SO2 Column Retrievals Reflect Anthropogenic Emissions OMI Improved SO2 Vertical Columns for 2006 Agreement with Aircraft Observations (INTEX-B): slope = 0.95, r=0.92 Lee et al., JGR, 2009
Use OMI SO2 Columns to Map SO2 EmissionsApply GEOS-Chem for the Inversion Tropospheric SO2 column ~ ESO2 Over Land day OH, cloud SO42- DMS SO2 ~day Deposition Emission Phytoplankton Combustion, Smelters, Volcanoes
Global Sulfur Emissions Over Land for 2006 Top-Down (OMI) 49.9 Tg S/yr r = 0.77 vs bottom-up Bottom-Up in GEOS-Chem (EDGAR2000, NEI99, EMEP2005, Streets2006) Scaled to 2006 54.6 Tg S/yr SO2 Emissions (1011 molecules cm-2 s-1) Top-Down Minus Bottom-up Volcanic SO2 Columns (>10 DU) Excluded From Inversion Lee et al., JGR, submitted
A-Train Has Provided Unprecedented Insight Into Global Air Quality Challenges Chemical Transport Model Plays a Critical Role in Relating Retrieved and Desired Quantity • Develop retrievals to increase boundary-layer information • Continue to develop simulation to relate retrieved and desired quantity • Develop comprehensive assimilation capability • (i.e. CALIPSO vertical profiles and OMI SO2 to inform AOD/PM2.5 relationship) Acknowledgements NASA, NSERC, Health Canada, Environment Canada