Download
1 / 74
740 likes | 897 Views
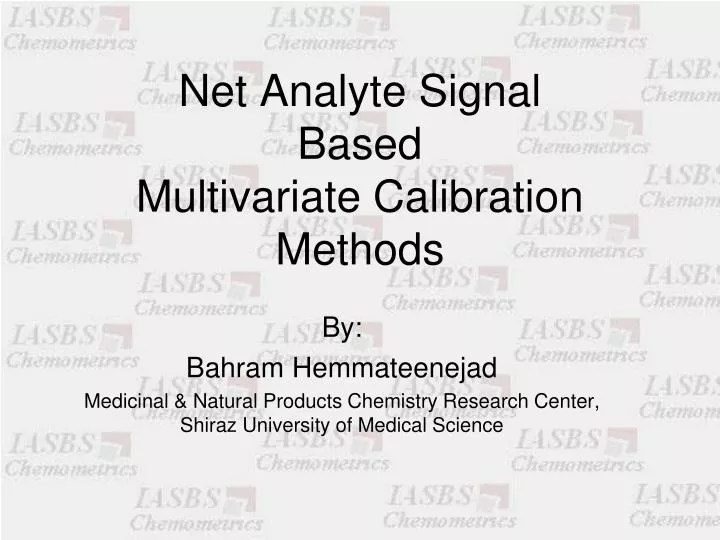
Net Analyte Signal Based Multivariate Calibration Methods. By: Bahram Hemmateenejad Medicinal & Natural Products Chemistry Research Center, Shiraz University of Medical Science. Multivariate Calibration. CLS A = C S ILS c = A S PCR A = T P, c = T s

E N D
Net Analyte Signal BasedMultivariate Calibration Methods By: Bahram Hemmateenejad Medicinal & Natural Products Chemistry Research Center, Shiraz University of Medical Science
Multivariate Calibration • CLS A = C S • ILS c = A S • PCR A = T P, c = T s • PLS A = T P, C = Q U Q = T b
Main Problems • Definition of figures of merit • Optimization of conditions • Optimum number of factors
Figure of merit • Sensitivity • Selectivity • Detection Limit Univariate Calibration
Optimization of conditions • Effect of pH • Effect of Temperature • Effect of Ionic Strength • Effect of Concentration • …
Optimum number of factors Cross Validation External Validation Minimum PRESS F-Ratio Over-fitting Under-Fitting
Net Analyte Signal(NAS) • A. Lorber, Anal. Chem. 58 (1986) 1167 • The part of mixture spectrum that is useful for model building • NAS is unique for the analyte of interest • NAS is a part of mixture spectrum which is orthogonal to the spectrum of all existing components except analyte • A part of mixture spectra which is directly related to the concentration of analyte
Net analyte signal, references • 1986 Proposed by Lorber. • Spectra of pure compounds available (CLS model). • 1997-2000 Extensions. • Inverse calibration (Lorber,Faber,Kowalski) • Figures of merit (sensitivity, selectivity, limit of detection) (Faber) • 1998-2002 Applications, Software. • Outlier detection. (Faber, Xu, Ferre) • Biomedical & Pharmaceutical. (Goicoechea, Skibsted) • Spectral preprocessing. (Faber, Brown, Wentzell) • Wavelength selection. (Goicoechea, Xu) • Preprocessing and wavelength selection (Skibsted, Boelens)
M1 M2 M3 y x 2x 3x 3y M3 2y M2 y M1 x
R (ixj) matrix of mixture spectra • Rk(ixj) matrix of analyte k spectra • R-k (ixj) matrix of background (other analytes + interferences • R = C S • Rk = sk ck • R = Rk + R-k • F R = FRk + FR-k, FR-k = 0 • F R = FRk R* = F sk ck= sk* ck
F = I – R-k+ R-k • R* = (I – R-k+ R-k)R = R - R-k+ R-kR • (I – R-k+ R-k)R-k = 0 • Key Step R-k • Rank Annihilation Factor Analysis (RAFA)
CLS approach • Rk = skck • R-k = R – Rk • ILS approach • R-k = R - r ck • r is a linear combination of the rows of R • ck = RR-1ck • = 1/ rTR+ck
Another approach • R-k = [ I – ck(ckT ck)-1 ckT]R • Other approaches • Xu & Schechter Anal. Chem. 69 (1997) 3722 • Faber Anal. Chem. 70(1998) 5108
Review of NAS calculation • Determining No. of analytes (p) • Preparing mixture standard solutions (j) • Recording absorbance spectra of solutions at (i) sensors (R matrix) • Recording absorbance spectrum of unknown (run vector) • Calculation of R-k
Calculation of calibration NAS • R* = (I – R-k+ R-k)R • Calculation of the NAS for unknown • r*un = (I – R-k+ R-k)run • Calculation of the pure NAS • s*k = (I – R-k+ R-k)sk