Download
1 / 126
1.26k likes | 1.51k Views
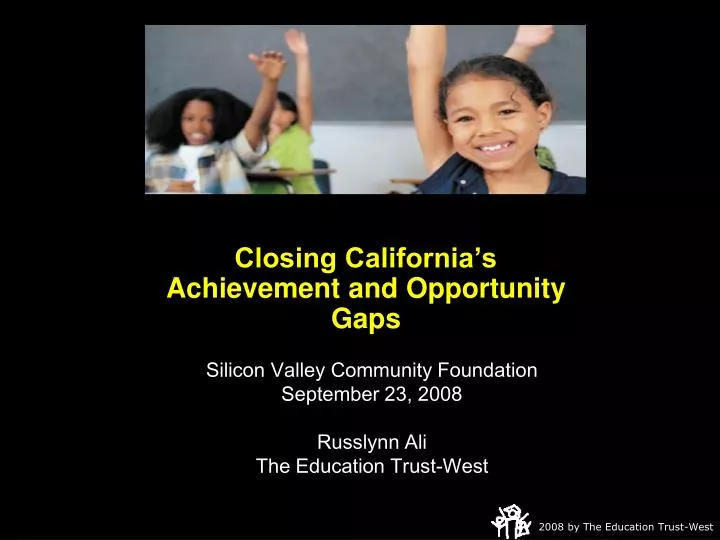
Closing California’s Achievement and Opportunity Gaps. Silicon Valley Community Foundation September 23, 2008 Russlynn Ali The Education Trust-West. California is now faced with twin achievement gaps:. The gap separating California’s students from their peers in other states; and

E N D
Closing California’s Achievement and Opportunity Gaps Silicon Valley Community Foundation September 23, 2008 Russlynn Ali The Education Trust-West
California is now faced with twin achievement gaps: • The gap separating California’s students from their peers in other states; and • The gap separating low-income students and students of color from other Californian students. We cannot close the first gap without attending to the second.
2007 NAEP Grade 4 Reading Average Overall Scale Scores by State Proficient Scale Score: 238 National Average Source: National Center for Education Statistics, NAEP Data Explorer, http://nces.ed.gov/nationsreportcard/nde/
2007 NAEP Grade 4 Reading Average Latino Scale Scores by State Proficient Scale Score: 238 Source: National Center for Education Statistics, NAEP Data Explorer, http://nces.ed.gov/nationsreportcard/nde/
2007 NAEP Grade 8 Math Average Overall Scale Scores by State Proficient Scale Score: 299 National Average California Source: National Center for Education Statistics, NAEP Data Explorer, http://nces.ed.gov/nationsreportcard/nde/
2007 NAEP Grade 8 Math Average African American Scale Scores by State Proficient Scale Score: 299 National Average California Source: National Center for Education Statistics, NAEP Data Explorer, http://nces.ed.gov/nationsreportcard/nde/
2007 NAEP Grade 8 Math Average White Scale Scores by State Proficient Scale Score: 299 National Average California Source: National Center for Education Statistics, NAEP Data Explorer, http://nces.ed.gov/nationsreportcard/nde/
These gaps begin before children arrive at the schoolhouse door. But, rather than organizing our educational system to ameliorate this problem, we organize it to exacerbate the problem.
But by Middle and High School Gaps Grow Increasingly Wider. In both Reading and Math. By the end of high school, even for those students that stay in our school, the gaps are staggering.
And these are for the students that are left. Dropout rates are staggering, even if unclear. We lose most kids between 9th and 10th grades.
Graduate Rates - Class of 2006. Source: Education Trust-West Analysis of CDE data, using the Manhattan Institute methodology
Even Fewer Graduate College Ready. *California: Class of 2006. *Includes 9th graders who have completed the A-G course sequence with a “C” or better in each class four years later. Source: Education Trust-West Analysis of CDE data, using the Manhattan Institute methodology
How? By giving students who arrive with less, less in school, too.
Ralph J. Bunche Elementary SchoolCompton Unified School DistrictCarson, California • 417 students in grades K-5 • 99% African American and Latino • 40% English Language Learner • 93% Low-Income Source: California Department of Education, http://dq.cde.ca.gov/dataquest/
Ralph Bunche Students Outpacing District and State2007 API Source: California Department of Education, http://dq.cde.ca.gov/dataquest/
Ralph Bunche Success at Every Grade LevelMath 2007 Source: California Department of Education, http://dq.cde.ca.gov/dataquest/
Stagg Street Elementary School Los Angeles Unified School District Van Nuys, California
Stagg Street Elementary SchoolVan Nuys, California • 452 students in grades K-5 • 73% Latino • 35% English Language Learner • 74% Low-Income Source: California Department of Education, http://dq.cde.ca.gov/dataquest/
Stagg’s 4th Graders Outperform District, County and StateMath 2007 Source: California Department of Education, http://dq.cde.ca.gov/dataquest/
Stagg’s 4th Graders Outperform District, County and State ELA 2007 Source: California Department of Education, http://dq.cde.ca.gov/dataquest/
KIPP San Francisco Bay Academy San Francisco Unified School District San Francisco, California
KIPP San Francisco Bay AcademySan Francisco, California • 257 students in grades 5-8 • 79% African American and Latino • 81% Low-Income Source: California Department of Education, http://dq.cde.ca.gov/dataquest/
5th Graders’ High Achievement at KIPP SF Bay AcademyMath 2007 Source: California Department of Education, http://dq.cde.ca.gov/dataquest/
5th Graders’ High Achievement at KIPP SF Bay Academy Science 2007 Source: California Department of Education, http://dq.cde.ca.gov/dataquest/
Hill Middle School Long Beach Unified School District Long Beach, California
Hill Middle SchoolLong Beach, California • 1088 students in grades 6-8 • 72% African American and Latino • 75% Low-Income Source: California Department of Education, http://dq.cde.ca.gov/dataquest/
Hill Middle School Outpaces the Districtand State - API 2007 Source: California Department of Education, http://dq.cde.ca.gov/dataquest/
Abraham Lincoln High School San Jose Unified School District San Jose, California