Download
1 / 2
20 likes | 91 Views
Contact iSN Global Solutions for our Market Research Services. We have expert professionals who can give you a clear picture of the market and the opportunities you can bank on. We assure the data and statistics are taken from verified sources at ISN. Click Here @ http://isngs.com/contacts/

E N D
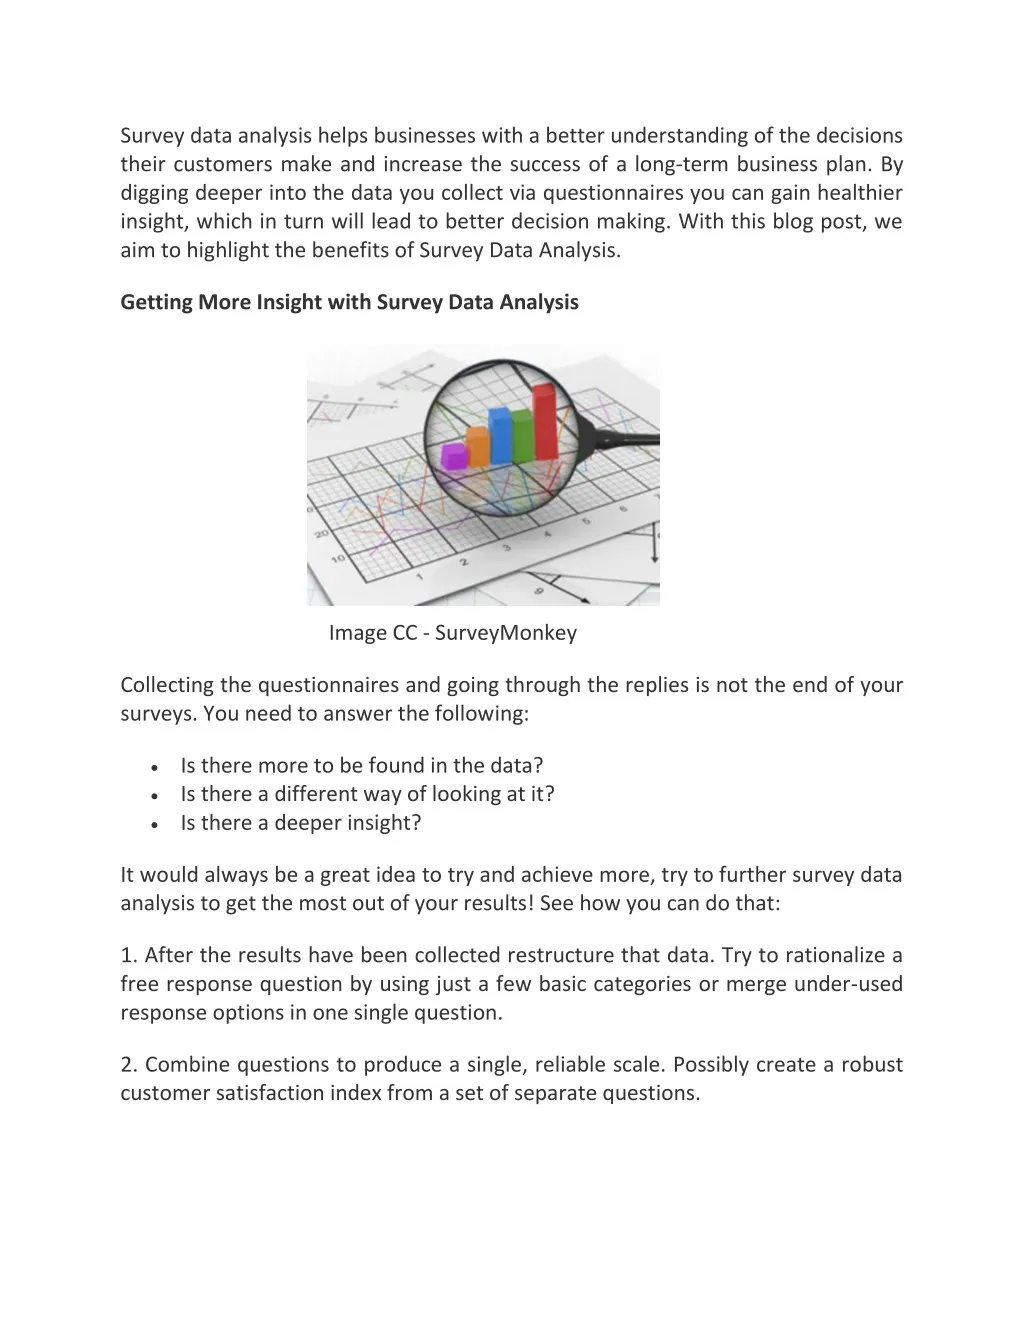
Survey data analysis helps businesses with a better understanding of the decisions their customers make and increase the success of a long-term business plan. By digging deeper into the data you collect via questionnaires you can gain healthier insight, which in turn will lead to better decision making. With this blog post, we aim to highlight the benefits of Survey Data Analysis. Getting More Insight with Survey Data Analysis Image CC - SurveyMonkey Collecting the questionnaires and going through the replies is not the end of your surveys. You need to answer the following: Is there more to be found in the data? Is there a different way of looking at it? Is there a deeper insight? It would always be a great idea to try and achieve more, try to further survey data analysis to get the most out of your results! See how you can do that: 1. After the results have been collected restructure that data. Try to rationalize a free response question by using just a few basic categories or merge under-used response options in one single question. 2. Combine questions to produce a single, reliable scale. Possibly create a robust customer satisfaction index from a set of separate questions.
3. Explore how responses to different questions are related. For example, the salary is more important than working conditions for retaining employees or how is consumer spending affected by optimism about the future. 4. Find out if there is a real and meaningful difference between groups. 5. Filter particular groups from an analysis. Image CC - iMotions There are many ways to get more from the survey data analysis. You may simply want to reorganize a couple of the questions or explore the results in a slightly different way. Alternatively, you may have specific business issues you want to understand better through the accuracy of the statistics. Maybe you just want a little guidance on survey design, the analysis or help with managing the data. Whatever your need, our iSN’s team of experts can provide as much or as little support as you require to help you get the most out of your data. It’s time to arm yourself with valuable information, information which is crucial to make informed business decisions, innovation and growth. Contact iSN Global Solutions for our Market Research Services. We have expert professionals who can give you a clear picture of the market and the opportunities you can bank on. We assure the data and statistics are taken from verified sources at ISN.