Download
1 / 1
10 likes | 190 Views
Data Point Visualization and Clustering Analysis. Mentors: Jong Youl Choi, Ruan Yang , and Seung-Hee Bae. Members: Joyce Bevins , Keenan Black, and Cornelius Myles. Abstract :

E N D
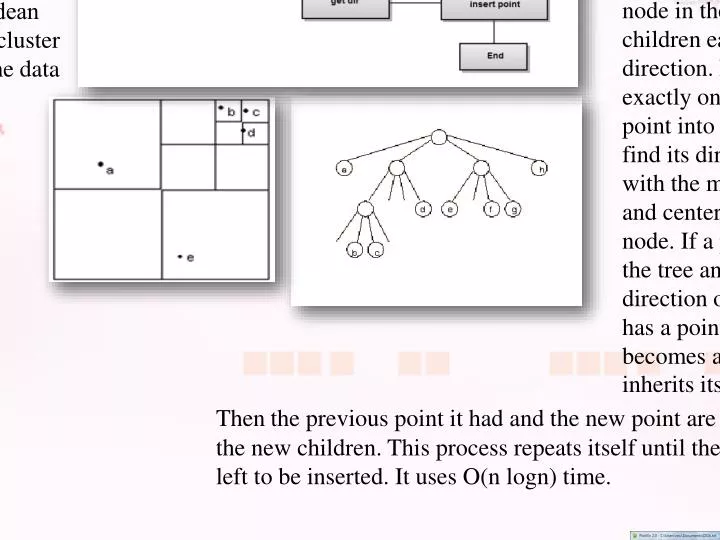
Data Point Visualization and Clustering Analysis Mentors: Jong Youl Choi, Ruan Yang, and Seung-HeeBae Members: Joyce Bevins, Keenan Black, and Cornelius Myles Abstract: The primary purpose of this research project was to create a research tool for 3D data point visualization and clustering analysis, which is one of the most popular data analysis methods in bioinformatics and cheminformatics. For this purpose, we have implemented the Barnes-Hut Tree algorithm in C# to visualize cluster structures of 3-dimenisional data and added the function to a visualization tool, called PlotViz, which is written in C# and Microsoft XNA graphic libraries, developed by the CGL research lab in Indiana University. We have also performed clustering analysis of real research data used in IU bio- and chem-informatics research groups. Among many clustering algorithms available, in our analysis, we have applied two popular clustering algorithms, k-means and hierarchical clustering, by using R, which is a standard statistical analysis tool, and compared the qualities by measuring “withinness” which is the sum of Euclidean distances between cluster centers and points for each cluster group. The results are also compared by visualizing the data points in 3D by using PlotViz. Flow Chart of BH Tree Implementation The Barnes-Hut Algorithm Works by grouping points using a hierarch of cubes arranged in an oct-tree structure. Each parent node in the tree has eight children each having its own direction. Each child can contain exactly one point. To insert a point into the tree you must first find its direction by comparing it with the minimum, maximum, and center point of the parent node. If a point is inserted into the tree and it has the same direction of a child that already has a point then that child becomes a parent node and it inherits its eight children. • Key Words: BH-Tree, K-means, H (Hierarchical) Cluster, • C# (sharp), XNA, PlotViz, R Oil data Thenthe previous point it had and the new point are inserted into one of the new children. This process repeats itself until there are no more points left to be inserted. It uses O(n logn) time. Barnes-Hut Tree using PubChem data . 1k points. Oil Data 1400 1200 1000 800 600 400 200 2468101214 Breast Cancer Results Our results show that the overall withinness goes down with the amount of clusters you have. Withinness measurement is used to represent how the points in 3D space are related to each other. There are some clusters along the slope that doesn’t stay consistent with the graph. The graph can be used to determine the best number of clusters of a given data set. 40000 30000 20000 10000 2468101214 PubChem Data 8e+06 6e+06 4e+06 2e+06 2468101214