Download
1 / 31
310 likes | 442 Views
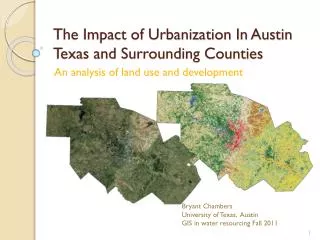
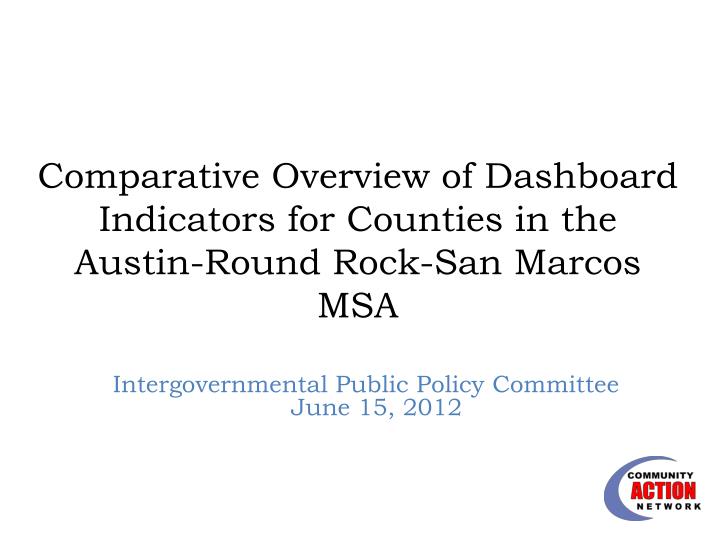
Comparative Overview of Dashboard Indicators for Counties in the Austin-Round Rock-San Marcos MSA. Intergovernmental Public Policy Committee June 15, 2012. Basic Demographics - Population. Bastrop County 74,171 Caldwell County 38,066

E N D
Comparative Overview of Dashboard Indicators for Counties in the Austin-Round Rock-San Marcos MSA Intergovernmental Public Policy Committee June 15, 2012
Basic Demographics - Population • Bastrop County 74,171 • Caldwell County 38,066 • Hays County 157,107 • Travis County 1,024,266 • Williamson County 422,679
Austin-Round Rock MSA 2000 - 2010 2010 Population # and % Growth since 2000 • Williamson County • tot. pop. 422,679 69%⇧ • Travis County • tot. pop. 1,024,266 26%⇧ From 2000 – 2010, the five-county Austin metro area was the fastest growing metro in Texas and the 8th fastest growing in the nation. • Bastrop County • tot. pop. 74,171 28%⇧ • Hays County • tot. pop. 157,107 61%⇧ • Caldwell County • tot. pop. 38,066 18%⇧ Source: U. S. Census Bureau (American Community Survey 1-Yr. Estimates and Decennial Census)
Austin-Round Rock MSA 2000 - 2010 2010 Population # and % Growth since 2000 2010 Federal Poverty Level # and % Growth since 2000 • Williamson County • tot. pop. 422,679 69%⇧ • poverty 34,069 190%⇧ • Travis County • tot. pop. 1,024,266 26%⇧ • poverty 194,156 95%⇧ • Bastrop County • tot. pop. 74,171 28%⇧ • poverty 11,708 81%⇧ • Hays County • tot. pop. 157,107 61%⇧ • poverty 22,962 76%⇧ • Caldwell County • tot. pop. 38,066 18%⇧ • (low-income and poverty data not available) Source: U. S. Census Bureau (American Community Survey 1-Yr. Estimates and Decennial Census)
Austin-Round Rock MSA 2000 - 2010 2010 Population # and % Growth since 2000 2010 Federal Poverty Level # and % Growth since 2000 2010 Low Income (200% of FPL) and % Growth since 2000 • Williamson County • tot. pop. 422,679 69%⇧ • poverty 34,069 190%⇧ • low-income 101,694 184%⇧ • Travis County • tot. pop. 1,024,266 26%⇧ • poverty 194,156 95%⇧ • low-income 375,147 66%⇧ • Bastrop County • tot. pop. 74,171 28%⇧ • poverty 11,708 81%⇧ • low-income 28,850 72%⇧ • Hays County • tot. pop. 157,107 61%⇧ • poverty 22,962 76%⇧ • low-income 46,256 66%⇧ • Caldwell County • tot. pop. 38,066 18%⇧ • (low-income and poverty data not available) Source: U. S. Census Bureau (American Community Survey 1-Yr. Estimates and Decennial Census)
Basic Demographics – Race/Ethnicity Bastrop Hays Travis Non-Hispanic White Hispanic or Latino Non-Hispanic Black Non-Hispanic Asian Non-Hispanic Other Race/Two or More Races Caldwell Williamson
Basic Demographics - Age • Age demographics are fairly similar across the five counties • Under 18 – Ranges from 24% of the population in Travis County to 29% of the population in Williamson County • 18-64 – Ranges from 62% in Bastrop, Caldwell, and Williamson County to 69% in Travis County • 65 and Over – Ranges from 7% in Travis County to 12% in Caldwell County
Arrest Disproportionality by Race • African Americans are disproportionately booked into the Travis County jail • African Americans make up 8% of the total adult population, but represent 23% of all those booked into the Travis County jail. • Data collection is in progress for other counties in the region
Voter Turnout Disproportionality by Age • Young people are much less likely to participate in elections than people 35 and older in Travis County • Data collection is in progress for other counties in the region
Homelessness None 21-40 41-60 1-20 More than 100 61-80 81-100
Things to Consider • Williamson County and Hays County have the fastest growth rates in the region • Population concentrations tend to lead to: • Increased housing & commuting costs • Greater crime, pollution, & exposure to disease
Things to Consider • Williamson County, the 2nd most populous county in the region, fares the best on many of the dashboard indicators • A relatively small low-income population is a contributing factor • What is Williamson County doing right?
Contact Information • Questions should be directed to: Chantel Bottoms CAN Senior Research Analyst (512)414-0327 chantel.bottoms@austinisd.org