Download
1 / 1
10 likes | 94 Views
Table 3. Results from Constructed Wetland Treatment System Bird Surveys. Table amended from Kadlec & Knight, 1996. Sites are listed by increasing marsh area. Compared with several other

E N D
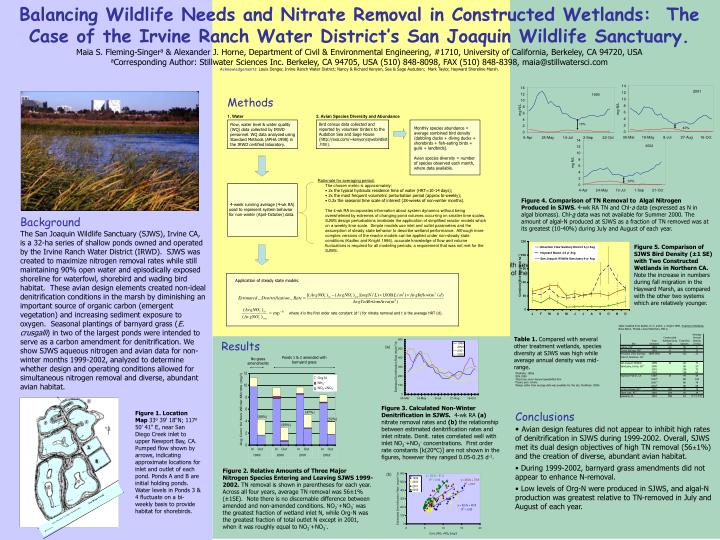
Table 3. Results from Constructed Wetland Treatment System Bird Surveys. Table amended from Kadlec & Knight, 1996. Sites are listed by increasing marsh area. Compared with several other treatment wetlands, counts at SJWS are high for total number of species observed and in the middle of the range for average annual density. A B A B San Deigo Creek Flow Direction To Upper Newport Bay Org-N NH4+ NO2-+NO3- In Out 1999 In Out 2000 In Out 2001 In Out 2002 Balancing Wildlife Needs and Nitrate Removal in Constructed Wetlands: The Case of the Irvine Ranch Water District’s San Joaquin Wildlife Sanctuary. Maia S. Fleming-Singera & Alexander J. Horne, Department of Civil & Environmental Engineering, #1710, University of California, Berkeley, CA 94720, USA aCorresponding Author: Stillwater Sciences Inc. Berkeley, CA 94705, USA (510) 848-8098, FAX (510) 848-8398, maia@stillwatersci.com Acknowledgements: Louis Denger, Irvine Ranch Water District; Nancy & Richard Kenyon, Sea & Sage Audubon; Mark Taylor, Hayward Shoreline Marsh. • Methods 1. Water 2. Avian Species Diversity and Abundance Bird census data collected and reported by volunteer birders to the Audobon Sea and Sage House (http://exo.com/~kenyon/sjwsbirdlist.htm). Flow, water level & water quality (WQ) data collected by IRWD personnel. WQ data analyzed using Standard Methods (APHA 1998) in the IRWD certified laboratory. 10% Monthly species abundance = average combined bird density (dabbling ducks + diving ducks + shorebirds + fish-eating birds + gulls + landbirds). Avian species diversity = number of species observed each month, where data available. 40% • Rationale for averaging period: • The chosen metric is approximately: • 2x the typical hydraulic residence time of water (HRT=10-14 days); • 2x the most frequent volumetric perturbation period (approx bi-weekly); • 0.2x the seasonal time scale of interest (28-weeks of non-winter months). • The 4-wk RA incorporates information about system dynamics without being overwhelmed by extremes of changing pond volumes occurring on smaller time scales. SJWS design perturbations invalidate the application of simplified reactor models which on a weekly time scale. Simple models use inlet and outlet parameters and the assumption of steady state behavior to describe wetland performance. Although more complex versions of the reactor models can be applied under non-steady state conditions (Kadlec and Knight 1996), accurate knowledge of flow and volume fluctuations is required for all modeling periods; a requirement that was not met for the SJWS. 30% Figure 4. Comparison of TN Removal to Algal Nitrogen Produced in SJWS. 4-wk RA TN and Chl-a data (expressed as N in algal biomass). Chl-a data was not available for Summer 2000. The amount of algal-N produced at SJWS as a fraction of TN removed was at its greatest (10-40%) during July and August of each year. 4-week running average (4-wk RA) used to represent system behavior for non-winter (April-October) data. Background The San Joaquin Wildlife Sanctuary (SJWS), Irvine CA, is a 32-ha series of shallow ponds owned and operated by the Irvine Ranch Water District (IRWD). SJWS was created to maximize nitrogen removal rates while still maintaining 90% open water and episodically exposed shoreline for waterfowl, shorebird and wading bird habitat. These avian design elements created non-ideal denitrification conditions in the marsh by diminishing an important source of organic carbon (emergent vegetation) and increasing sediment exposure to oxygen. Seasonal plantings of barnyard grass (E. crusgalli) in two of the largest ponds were intended to serve as a carbon amendment for denitrification. We show SJWS aqueous nitrogen and avian data for non-winter months 1999-2002, analyzed to determine whether design and operating conditions allowed for simultaneous nitrogen removal and diverse, abundant avian habitat. Figure 5. Comparison of SJWS Bird Density (±1 SE) with Two Constructed Wetlands in Northern CA. Note the increase in numbers during fall migration in the Hayward Marsh, as compared with the other two systems which are relatively younger. Application of steady state models. where k is the first order rate constant (d-1) for nitrate removal and t is the average HRT (d). Table modifed from Kadlec, R. H. and R. L. Knight 1996. Treatment Wetlands. Boca Raton, Florida, Lewis Publishers, 893 p. Table 1. Compared with several other treatment wetlands, species diversity at SJWS was high while average annual density was mid-range. • Results (a) Ponds 1 & 2 amended with barnyard grass No grass amendments aMcAllister 1993a bEPA 1999 chttp://exo.com/~kenyon/sjwsbirdlist.htm dTaylor, pers. Comm. eRange rather than average data was available for this site. McAllister 1993b Figure 3. Calculated Non-Winter Denitrification in SJWS. 4-wk RA (a) nitrate removal rates and (b) therelationship between estimated denitrification rates and inlet nitrate. Denit. rates correlated well with inlet NO2-+NO3- concentrations. First order rate constants [k(20°C)] are not shown in the figures, however they ranged 0.05-0.25 d-1. Figure 1. Location Map 33o 39' 18"N; 117o 50' 41" E, near San Diego Creek inlet to upper Newport Bay, CA. Pumped flow shown by arrows, indicating approximate locations for inlet and outlet of each pond. Ponds A and B are initial holding ponds. Water levels in Ponds 3 & 4 fluctuate on a bi-weekly basis to provide habitat for shorebirds. • Conclusions • Avian design features did not appear to inhibit high rates of denitrification in SJWS during 1999-2002. Overall, SJWS met its dual design objectives of high TN removal (56±1%) and the creation of diverse, abundant avian habitat. • During 1999-2002, barnyard grass amendments did not appear to enhance N-removal. • Low levels of Org-N were produced in SJWS, and algal-N production was greatest relative to TN-removed in July and August of each year. (47%) (60%) (52%) (69%) A B Figure 2. Relative Amounts of Three Major Nitrogen Species Entering and Leaving SJWS 1999-2002. TN removal is shown in parentheses for each year. Across all four years, average TN removal was 56±1% (±1SE). Note there is no discernable difference between amended and non-amended conditions. NO2-+NO3- was the greatest fraction of wetland inlet N, while Org-N was the greatest fraction of total outlet N except in 2001, when it was roughly equal to NO2-+NO3-. (b)