Download
1 / 33
330 likes | 517 Views
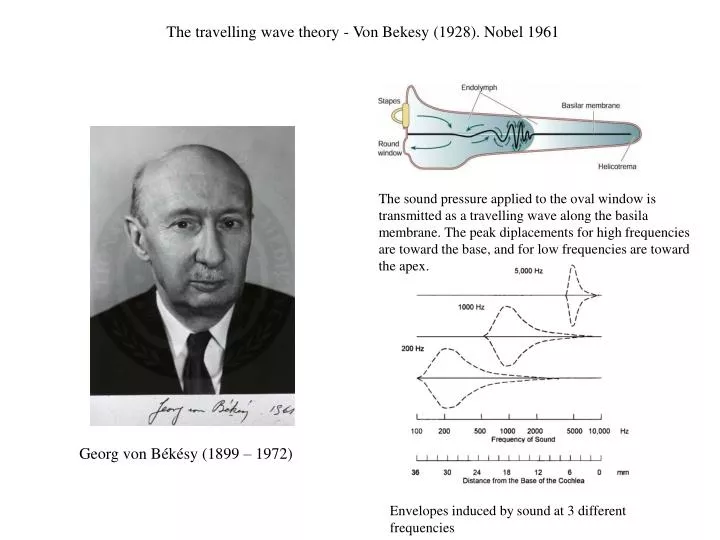
The travelling wave theory - Von Bekesy (1928). Nobel 1961. The sound pressure applied to the oval window is transmitted as a travelling wave along the basila membrane. The peak diplacements for high frequencies are toward the base, and for low frequencies are toward the apex.

E N D
The travelling wave theory - Von Bekesy (1928). Nobel 1961 The sound pressure applied to the oval window is transmitted as a travelling wave along the basila membrane. The peak diplacements for high frequencies are toward the base, and for low frequencies are toward the apex. Georg von Békésy(1899 –1972) Envelopes induced by sound at 3 different frequencies
Problem: envelopes of the travelling waves are wide while we are hearing pure tones There must be additional mechanism for tunning of the auditory system to the sound frequency. Proof: movements of the basilar membrane Effect of cochlear amplifier. C) The peak due to cochlear amplifier. D) Amplitude of the passive movement of basilar membrane in the absence of the cochlear amplifier.
The Organ of Corti The organ of Corti is the receptor organ of the inner ear, containing the hair cells and a variety of supporting cells. Transsection through cochlea showing the organ of Corti
Two types of hair cells Scanning electron micrographs of the organ of Corti after removal of the tectorial membrane. Inner hair cells are arranged in the single row. Outer hair cells are arranged in the three rows and the stereocilia of each cell are arranged in a V configuration.
Organization and properties of the inner and outer hair cells A. Innervation pattern: 20000 nerve fibers connect to the 3500 IHC, while 1000 nerve fibers connect to the 20000 OHC. The IHC are the main sites of auditory transduction. B, C Response properties: stimulus oscillations (s) trigger similar oscillations in the membrane potential. Each cell has the best frequency for which, there is a peak in the tuning curve.
Functional organization of the inner and outer hair cells In both types of cells the initial depolarization is due to influx of K+. This leads to activation of a voltage-gated Ca2+ channels. Influx of Ca2+ provides for modulation of Ca2+ - sensitive K+ channels. The interplay of K+ and Ca2+ conductances produces an oscillating potential which generates an electrical resonance. It increases the response at the cell’s best frequency and sharpens the tuning curve within the cell. It also provides the means for the outer hair cells to produce mechanical output through voltage-mechanical converter (V-M).
Rock around the clock Hair Cell An outer hair cell is being stimulated electrically by a patch pipette which enters from the lower left. The cell’s potential is changed by by plugging Walkman into the input socket of the electrophysiology amplifier. The cell changes its length but its volume stays constant. The ‘motor’ is a transmembrane protein that mechanically contracts and elongates leading to electromotility. The molecule, discovered in 2000 is called ‘prestin’. (from: http://www.ucl.ac.uk/ear/research/ashmorelab)
The cochlear amplifier Shape changes of the outer hair cells due to rapidly oscillating membranne potential contribute to movement of the tectorial and basilar membranes. Inner hair cells are stimulated by the relative movements between these membranes. It is presumed that this mechanism contributes to the active tunning of hair cells responses.
Otoacoustic emission An otoacoustic emission (OAE) is a sound which is generated from within the inner ear. There are two types of otoacoustic emissions: spontaneous otoacoustic emissions, which can occur without external stimulation, and evoked otoacoustic emissions, which require an evoking stimulus. Most probably, otoacoustic emissions are produced by the cochlear outer hair cells as they expand and contract. Otoacoustic emissions are clinically are the basis of a simple, non-invasive, test for hearing defects in newborn babies. An example of multifrequency spontaneous otoacoustic emissions recorded from a 48-year-old woman with normal hearing. The black spikes represent the response above the noise floor. An example of evoked otoacoustic emissions and their spectra. Evoked otoacoustical emissions are evidence for a cochlear amplifier.
Mechanism of frequency tunning 2 – dependence on the location Many properties of IHC and OHC vary with the position along the cochlea. These differences are likely to be correlated with the differing frequencies that are processed along the cochlea, but the significance of these changes is still not understood.
Efferent fibers In addition to afferent fibers, the auditory nerve also contains efferent fibers, which arises from cells in the brain-stem. Efferent fibers inhibit mainly outer hair cells by hyperpolarizing the hair cells membrane. It reduces the motor output of the outer hair cells and reduces the movement of the tectorial and basilar membranes and the sensory response of the inner hair cells. Its role is assumed to be a protection agains overstimulation.
Tunning curves Tuning curves for cochlear hair cells. To construct a curve, the experimenter presents sound at each frequency at increasing amplitudes until the cell produces a criterion response, here 1 mV. The curve thus reflects the threshold of the cell for stimulation at a range of frequencies. Each cell is most sensitive to a specific frequency, its characteristic (or best) frequency. The threshold rises briskly (sensitivity falls abruptly) as the stimulus frequency is raised or lowered.
Auditory pathways • Auditorypathways: • - Cochlea • Cochlearnuclei(brain-stem) • Superior olivarynuclei (brain-stem) • Inferior colliculus (brain-stem) • Medialgeniculatenuclei (thalamus) • Auditorycortex Left Auditory cortex Right Auditory cortex Medial geniculate nucleus Cochlea Inferior colliculus Auditory nerve fiber Superior Olivary nucleus Ipsilateral Cochlear nucleus
Types of cells in the cochlear nuclei Auditory nerve fibers terminate in the cochlear nuclei (CN) on different types of cells with different response properties. Responses to a tone burst of 50 ms are shown. The ‘Primary-like’ preserve the envelope of the input signal, the ‘Pauser’ and the’Chopper’ provide for differentation between onset and ensuing phases of the tone, the ‘On’ cells signal the onset or timing of a sound. Each cell type represents an abstraction of one particular feature of the input. Different functional properties are processed and transmitted in parallel pathways. In humans, the receptor potentials of certain hair cells and the action potentials of their associated auditory nerve fiber can follow stimuli of up to about 3 kHz in a one-to-one fashion.
Sound localization in medial superior olive nuclei Diagram illustrating how the MSO computes the location of a sound by interaural time differences. A given MSO neuron responds most strongly when the two inputs arrive simultaneously, as occurs when the contralateral and ipsilateral inputs precisely compensate (via their different lengths) for differences in the time of arrival of a sound at the two ears. The systematic (and inverse) variation in the delay lengths of the two inputs creates a map of sound location: In this model, E would be most sensitive to sounds located to the left, and A to sounds from the right; C would respond best to sounds coming from directly in front of the listener. Psychophysical experiments show that humans can actually detect interaural time differences as small as 10 microseconds; This sensitivity translates into an accuracy for sound localization of about 1°. Interaural time differences are used to localize the source for frequencies below 3 kHz .
Sound localization in lateral superior olive nuclei Lateral superior olive neurons encode sound location through interaural intensity differences. LSO neurons receive direct excitation from the ipsilateral cochlear nucleus; input from the contralateral cochlear nucleus is relayed via inhibitory interneurons in the MNTB (medial nucleus of the trapezoid body). This excitatory/inhibitory interaction results in a net excitation of the LSO on the same side of the body as the sound source. In contrast, sounds arising from in front of the listener, will silence the LSO output. Interaural intensity differences are used to localize the source for frequencies above 2 kHz .
Tonotopic organisation The basilar membrane in the cochlea is tonotopically organized. The tonotopic organization is retained at all levels of the central auditory system.
The auditory cortex Diagram showing the brain in left lateral view, including the depths of the lateral sulcus, where part of the auditory cortex occupying the superior temporal gyrus normally lies hidden. The primary auditory cortex (A1) is shown in blue; the surrounding belt areas of the auditory cortex are in red. The primary auditory cortex has a tonotopic organization, as shown in the blowup diagram of a segment of A1. The Wernicke's area shown in gren is a region important in comprehending speech. It is just posterior to the primary auditory cortex.
Noise and music fMRI activation during listening to noise (left) and music (right). Moderate activity level is present in the auditory areas during noise listening. These areas become more active during listening to the music. Besides, new areas are activated.
Vision Kanizsa triangle
The electromagnetic spectrum Electromagnetic waves with high frequencies has high energies that disrupt moelcular bonds. Waves with low frequencies have lower energies for which there are few know receptors in living organisms. There is a narrow band of wavelengths with medium energies that is called light.
Submodalities of vision Sensing changes in illumination that vary in time and space is called vision. Vision has large number of submodalities.
The eye The eye is designed to focus the visual image on the retina with minimal optical distortion. Lens change shape to focus light from different distances on the retina where photoreceptors are located. In one region of the retina, the fovea, the cell bodies of the proximal retinal neurons are shifted to the side, enabling the photoreceptors there to receive the visual image in its least distorted form. Humans constantly move their eyes so that scenes of interest are projected onto the fovea. • Fovea is characterized by: • - high density of photoreceptors • lack of blood vessels • location on the eye’s visual axis what minimizes the aberations
The mistake of evolution? Hypotheses: - protection against the damaging effects of light - sustaining the photoreceptors by the retinal pigment epithelium (recycling and metabolising their products) Side effect: - blind spot Left: schematic diagram of the retina by Santiago Ramon y Cajal (~1900). Right: section of rat’s retina. In vertebrates retina the light must pass through several inner layers of nerve cells and their processes before it reaches the photoreceptors. It is typical of vertebrates but rare among invertebrates.
Photoreceptors – rods and cones Distribution of rods and cones in the human retina • The human retina contains two types of photoreceptors, rods and cones. Cones are responsible for day vision. Rods mediate night vision • There are 20 times more rods than cones • Rods are 1000 times more sensitive to light than cones. Rods and cones in electron micorgraph
Visual acuity is highest in the fovea and decreases with distance from the fovea Special chart prepared to demonstrate how visual acuity decreases rapidly with target distance from the fovea. According to Anstis (1974) when the center of the chart is fixated at approximately normal reading distance, all the letters should be equally well readable, since increasing target distance from the fovea is compensated by a corresponding increase in letter size. From: Anstis, S. A chart demonstrating variation in acuity with retinal position, Anstis S. Vision Research, 14 , 589-592 (1974).
The dark current In darkness two currents flow in a photoreceptor. An inward Na+ current flows through cGMP-gated channels, while an outward K+ current flows through nongated K+-selective channels. The outward current carried by the K+ channels tends to hyperpolarize the photoreceptor. The inward current tends to depolarize the photoreceptor. As a result, in darkness the photoreceptor's membrane potential is around -40 mV. The photoreceptor is able to maintain steady intracellular concentrations of Na+ and K+ in the face of these large fluxes because its inner segment has a high density of Na+-K+ pumps, which pump out Na+ and pump in K+ . In darkness the cytoplasmic concentration of cGMP is high, thus maintaining the cGMP-gated channels in an open state and allowing a steady inward current, called the dark current. When light reduces the level of cGMP, thus closing cGMP-gated channels, the inward current that flows through these channels is reduced and the cell becomes hyperpolarized to around -70 mV.
Three stages of phototransduction Phototransduction involves the closing of Na+ channels in the outer segment of the photoreceptor membrane. In the absence of light these channels are kept open by intracellular cGMP and conduct an inward Na+ current.. • Light is absorbed and activates pigment molecules (rhodopsin in rods) in the disc membrane. • The activated pigment stimulates a G protein (transducin in rods), which in turn activates cGMP phosphodiesterase. This enzyme catalyzes the breakdown of cGMP to 5c-GMP. • As the cGMP concentration is lowered, the cGMP-gated channels close, thereby reducing the inward current and causing the photoreceptor to hyperpolarize.
Retinal circuits The retina has three major functional classes of neurons. Photoreceptors (rods and cones) lie in the outer nuclear layer, interneurons (bipolar, horizontal, and amacrine cells) in the inner nuclear layer, and ganglion cells in the ganglion cell layer. Photoreceptors, bipolar cells, and horizontal cells make synaptic connections with each other in the outer plexiform layer. Information flows vertically from photoreceptors to bipolar cells to ganglion cells, as well as laterally via horizontal cells in the outer plexiform layer and amacrine cells in the inner plexiform layer.
„On” and „Off” ganglion cells Ganglion cells have circular receptive fields, with specialized center (pink) and surround (gray) regions. On-center cells are excited when stimulated by light in the center and inhibited when stimulated in the surround; off- center cells have the opposite responses. A. On-center cells respond best when the entire central part of the receptive field is stimulated (3). These cells also respond well, when only a portion of the central field is stimulated by a spot of light (1). Illumination of the surround with a spot of light (2) or ring of light (4) reduces or suppresses the cell firing. Diffuse illumination of the entire receptive field (5) elicits a relatively weak discharge because the center and surround oppose each other's effects. B. The spontaneous firing of off-center cells is suppressed when the central area of the receptive field is illuminated (1, 3). Light shone onto the surround of the receptive field excites the cell (2, 4). Conclusion: retinal ganglion cells respond optimally to contrast in their receptive fields.
Circuits generating the responses of the ganglion cells The horizontal cell receives input from a cone in the surround of the on-center bipolar cell and also has a connection with a postsynaptic cone in the center of the bipolar cell's receptive field. In the dark, horizontal cells release an inhibitory transmitter that maintains postsynaptic cones in the receptive field center in a slightly hyperpolarized state. Illumination of cones in the bipolar cell's surround hyperpolarizes those cones, which in turn hyperpolarize the postsynaptic horizontal cell. This hyperpolarization of the horizontal cell reduces the amount of inhibitory transmitter released by the horizontal cell onto postsynaptic cones in the receptive field center, and as a result these cones become depolarized (the opposite effect of light absorption by these cones). This in turn allows the on- center bipolar cell to become hyperpolarized, the opposite effect of illumination in the receptive field center. Each bipolar cell makes an excitatory connection with a ganglion cell of the same type. When the cone is hyperpolarized by light, the on-center bipolar cell is excited and the off-center bipolar cell is inhibited. This is because the two types of bipolar cells have different postsynaptic receptors to the transmitter released by the cone. The responses of the ganglion cells are largely determined by the inputs from the bipolar cells.
Each region of the retina has several functionally distinct subsets of ganglion cells that convey, in parallel pathways, signals from the same photoreceptors. Most ganglion cells in the primate retina fall into two functional classes, M (for magni, or large) and P (for parvi, or small). Each class includes both on-center and off- center cells. Ganglion cell types (P) (M) Parallel networks of ganglion cells with different functional properties are the beginning of the segregation of information into parallel processing pathways in the visual system.