Download

1 / 19
190 likes | 316 Views
TPFL: Turbine Cascade Unsteady Boundary Layer Research.

E N D
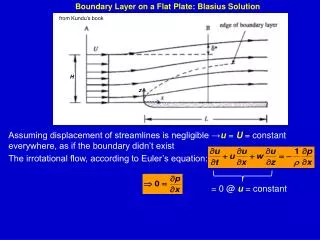
TPFL: Turbine Cascade Unsteady Boundary Layer Research Cascade Flow Research CapabilityFollowing figures present experimental results dealing with the measurement of boundary layer development along the suction surface of a low pressure turbine blade under periodic unsteady wake flow conditions.For more details, please see the publication list in CVCV of Dr. Schobeiri
Introduction: Wake Interaction • Boundary transition in turbomachines is determined by: • Change of frame of reference that inherently causes periodic unsteady flow consisting of wakes with high TI- vortical cores and low TI- flow region • Wake flow impinges on the surface of the following cascade and periodically changes the portion of the laminar boundary layer to turbulent and affects the turbine aerodynamics, efficiency, performance and heat transfer Schematics of Rotor-Stator Interaction
TPFL Unsteady Turbine Cascade Research Facility Simulation of periodic unsteady wakes impinging on turbine blades TPFL: The Turbomachinery Performance and Flow Research Laboratory Texas A&M University M. T. Schobeiri
INTRODUCTION: LOW-PRESSUER TURBINE AERODYNAMICS Fig. 1: A twin-spool aircraft gas turbine with a fan-stage, HP, IP, and LP compressor and turbine stages Low Pressure Turbine (LPT) stage of aircraft gas turbine engines operates within the following Re-range: • Take off: Re = 400,000 (high Re) • Cruise: Re = 100,000 (low Re) • Routine operations Re = 400,000 to 100,000 LP-Turbine
Introduction: LPT-Aerodynamics Suction Surface Pressure Surface Fig. 2: LPT-blade, suction side Fig. 3: Pressure distribution On Suction surface: Negative pressure gradient: Acceleration,stable laminar boundary layer Change of pressure gradient: Onset of aseparation bubble, manifestation Further change of pressure gradient: Re-attachment of separated flow
Parameters Affecting LPT-Aerodynamics Flow parameters: • Re Number, Mach Number • Unsteady Wakes - Wake Frequency - Wake Width - Wake Turbulence • Freestream Turbulence Intensity Blade geometry: • Suction, pressure surface configuration (front, aft-load) • Inlet, exit angle (total flow deflection) - Responsible for pressure distribution, location of separation bubble
RESEARCH OBJECTIVES • To investigate the impact of the periodic unsteady inlet flow conditions on the development of the boundary layer separation. • To provide detailed steady and unsteady boundary flow information to understand the underlying physics of the onset and the extent of the separation zone under the unsteady wake effects. • To extend the intermittency based unsteady boundary layer transition model developed by Schobeiri and his co-workers to the boundary layer cases with separation. • To create a bench mark data base for comparison with numerical computation using DNS or RANS-codes.
RESULTS AND DISCUSSIONS:Unsteady Wake Flow Investigations Time-averaged velocity profiles along the suction surface of the blade atΩ=0
Periodic Generation and Suppression of the Separation Bubble Contour plot of the ensemble averaged velocity distribution showing the effect of periodic wakes an the separation zone at different streamwise positions at Ω =1.59
Periodic Generation and Suppression of the Separation Bubble Contour plot of the ensemble averaged velocity distribution showing the effect of periodic wakes an the separation zone at different streamwise positions at Ω =1.59
Periodic Generation and Suppression of the Separation Bubble Temporal behavior of the separation zone behavior unsteady case Ω =1.59 (SR =160mm)
Periodic Generation and Suppression of the Separation Bubble Temporal behavior of the separation zone behavior unsteady case Ω =1.59 (SR =160mm). Note the development of the separation bubble.
Periodic Generation and Suppression of the Separation Bubble Physics of Contraction, Separation and Regeneration of the Separation Zone
More Details on Generation and Suppression of the Separation Bubble Contraction, Separation and Regeneration of the Separation Zone
Periodic Generation and Suppression of the Separation Bubble Details: Contraction phase starts at the point, where vrms/t > 0 start, Regeneration phase starts at the point, where of vrms/t < 0 starts
Boundary Layer Integral Quantities Boundary layer ensemble-averaged integral momentum deficiency thickness for steady case Ω =0 (SR = )and unsteady cases Ω =1.59(SR =160mm) and Ω =3.18 (SR =80mm)
Boundary Layer Integral Quantities Boundary layer momentum thickness time-averaged