Download
1 / 14
140 likes | 313 Views
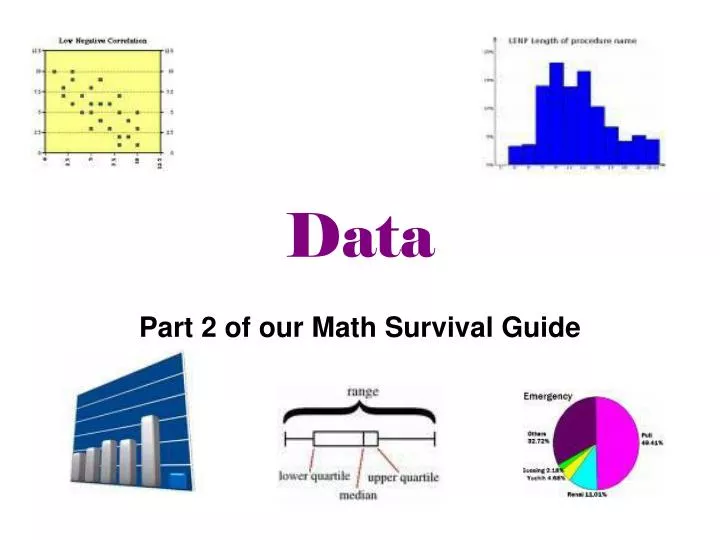
Data. Part 2 of our Math Survival Guide. I. Collecting Data. Data – Facts or numbers that are collected Survey – given to investigate opinions or behaviors by questioning a group Population – the group you want to find information about Census – a survey of the entire population

E N D
Data Part 2 of our Math Survival Guide
I. Collecting Data • Data – Facts or numbers that are collected • Survey – given to investigate opinions or behaviors by questioning a group • Population – the group you want to find information about • Census – a survey of the entire population • Sample – a group within a population
II. Frequency Distributions • Frequency distribution (frequency table) – a table that organizes data to show how many times each item or group of items appears • How do I use a frequency table? • How can I use a histogram to display the information from the frequency table?
Histogram 5 10 15 20 25 30 0 – 1 2 – 3 4 – 5 6 - 7
III. Measures of Central Tendencies • Mean – the average • Median – The middle number in a set of data • Mode – The number that occurs the most • What are the outliers and how do they affect a data set?________________
IV. Measures of Variation a. Range – the difference between the greatest and least values in a data set b. Quartiles • 1st Quartile – Lower Quartile (middle of the lower half of data) • 2nd Quartile – The median of a data set • 3rd Quartile – Upper Quartile (middle of the upper half of data) c. Interquartile Range – IQR = UQ – LQ d. Box-and-Whisker Plot
Box-and-Whisker Plot • 7 students rated the school food on a scale from one to ten 2, 4, 5, 5, 6, 8, 8 0 1 2 3 4 5 6 7 8 9 10
V. Tables and Graphs a. Line plots b. Histogram – bar graph with no spaces (best for intervals) c. Bar graph – bar graph that is equally spaced Blue Yellow Purple Black Red Other
V. Tables and Graphs d. Box-and-whisker plot – splits data into quartiles e. Scatter plot – points on a grid that show a relationship between two sets of data f. Line graph – shows trends over time g. Circle graph – shows percents (part/whole)
HINT: LOOK FOR PATTERNS! Examples As x increases, y ______________. As x increases, y ______________.
As x increases, y ______________. As x increases, y ______________.
As x increases, y ______________. As x increases, y ______________.