Download
1 / 47
470 likes | 594 Views
Whole genome comparisons: Gene order in genomes. The foundation Full Genome Sequences And Their Annotations. Comparative Genomics. To enhance annotation in each species. For evolutionary studies: “Genome Archeology”. …. For prokaryotes, many tools exist to do this at the DNA level,

E N D
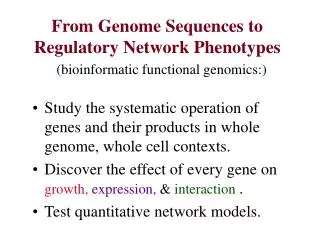
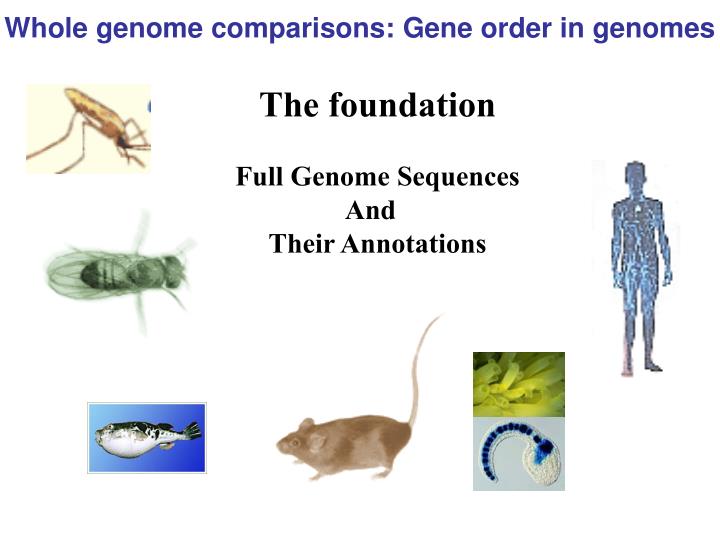
Whole genome comparisons: Gene order in genomes The foundation Full Genome Sequences And Their Annotations
Comparative Genomics To enhance annotation in each species For evolutionary studies: “Genome Archeology” …. For prokaryotes, many tools exist to do this at the DNA level, given that most of the genome is coding For Eukaryotes, often must turn to annotations: genes and proteins, In order to compare the most conserved part of genome
Comparative genome browser now for many pairs of organisms(Dual): Example -Human to Chicken (vista browser, UCSC)
Whole genome comparisons: Gene order in genomes Making syntenic alignments - Two steps -Define gene/protein “matches” (Blast or MUM-based) between ALL human and mouse genes/proteins (for a given Blast or MUM threshold). -Find all ‘clusters’ - groups of matches within a constrained interval along chromosome axes: U L A S V Z B C R D X E F G Z...Ordered Human | | | | | | | | | | | | | | P O A’H J B’C’T D’E’F’G’Y...Ordered Mouse -Define gene/protein “matches” (Blast or MUM-based) between ALL human and mouse genes/proteins (for a given Blast or MUM threshold). -Define gene/protein “matches” (Blast or MUM-based) between ALL human and mouse genes/proteins (for a given Blast or MUM threshold). -Find all ‘clusters’ - groups of matches within a constrained interval along chromosome axes: I’ W’’’ T O’’’’’ R’ CWB P WB’’ E F’E’FO’’’’ W’ A’’ GA’ E’’ G’ F’’ A’’’ AR’’’’W’’’’ V’’ O’’’ C’ M Q’R’’’ N D’ Q V U L A’’’’ B’’’’ C’’ I K DRB’’’ J I’’ O’’ Q’’ C’’’’ S B’ R’’ W’’ C’’ Y’ C H O’ I’ W’’’ T O’’’’’ R’ C W B P W B’’ E F’ E’ F O’’’’ W’ A’’ G A’ E’’ G’ F’’ A’’’ A R’’’’ W’’’’ V’’ O’’’ C’ M Q’ R’’’ N D’ Q V U L A’’’’ B’’’’ C’’ I K D R B’’’ J I’’ O’’ Q’’ C’’’’ S B’ R’’ W’’ C’’ Y’ C H O’ | | | | | | |
Whole genome comparisons: Gene order in genomes I. Human-mouse: Highly syntenic genomes Synteny at a higher degree than expected, with very little micro-rearrangement, and up to 95% synteny. II. Human-fly: limited syntenic stretches Probable limit of detection of synteny. Very limited stretches of order found - possibly only those due to functional constraints.
Whole genome comparisons: Gene order in genomes Finding Duplications and Syntenic Stretches by Comparing Genomes’ Predicted Proteomes Advantages -Use the most highly conserved portion of the genomes -As a work in progress, the genome Assembly and Annotation can be informed by synteny information Disadvantages -Assembly and Annotation shortcomings are at their most compounded
Whole genome comparisons: Gene order in genomes 2. Use algorithm to identify Clusters of matchesINPUT: ‘Candidate homolog pairs’ Mouse Chr16 Protein Order Human Protein Order Proteins On Chr16 Proteins In Human Proteome >CRA|mCP6859 9 >CRA|hCP1705416 23290 >CRA|mCP6859 9 >CRA|hCP1705430 23293 >CRA|mCP6898 10 >CRA|hCP1705598 23291 >CRA|mCP6951 11 >CRA|hCP1705430 23293 >CRA|mCP29489 12 >CRA|hCP1705586 23295 >CRA|mCP6934 13 >CRA|hCP1705405 23296 >CRA|mCP6955 14 >CRA|hCP1705439 23297 >CRA|mCP6901 17 >CRA|hCP1742270 5862 >CRA|mCP6901 17 >CRA|hCP1703178 23222 >CRA|mCP6901 17 >CRA|hCP1705512 23298 >CRA|mCP6903 18 >CRA|hCP1708442 10595 >CRA|mCP6903 18 >CRA|hCP1734625 19935 >CRA|mCP6903 18 >CRA|hCP1735935 21909 >CRA|mCP6903 18 >CRA|hCP1733662 22508 >CRA|mCP6903 18 >CRA|hCP1705563 23299
Whole genome comparisons: Gene order in genomes 2. Use algorithm to identify Clusters of matchesClustered ‘Candidate homolog pairs’ tagged by algorithm Mouse Chr16 Protein Order Human Protein Order Proteins On Chr16 Proteins In Human Proteome >CRA|mCP6859 9 >CRA|hCP1705416 23290 >CRA|mCP6859 9 >CRA|hCP1705430 23293 >CRA|mCP6898 10 >CRA|hCP1705598 23291 >CRA|mCP6951 11 >CRA|hCP1705430 23293 >CRA|mCP29489 12 >CRA|hCP1705586 23295 >CRA|mCP6934 13 >CRA|hCP1705405 23296 >CRA|mCP6955 14 >CRA|hCP1705439 23297 >CRA|mCP6901 17 >CRA|hCP1742270 5862 >CRA|mCP6901 17 >CRA|hCP1703178 23222 >CRA|mCP6901 17 >CRA|hCP1705512 23298 >CRA|mCP6903 18 >CRA|hCP1708442 10595 >CRA|mCP6903 18 >CRA|hCP1734625 19935 >CRA|mCP6903 18 >CRA|hCP1735935 21909 >CRA|mCP6903 18 >CRA|hCP1733662 22508 >CRA|mCP6903 18 >CRA|hCP1705563 23299
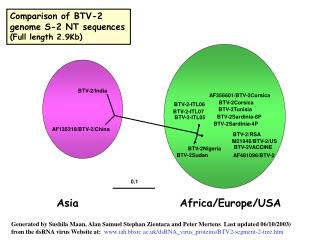
Whole genome comparisons: Gene order in genomes Mouse Chromosome 16 maps to Human Chromosomes 3, 8, 12, 16, 21, and 22 Mouse Chromosome 16
DNA and protein based alignment of mouse chromosome 16 to human chromosome stretches
Whole genome comparisons: Gene order in genomes Pre-genomic rough alignment - synteny Color coded human chromosomes Mouse chromosomes represented as aligned to human chromosomes: known from: -chromosome painting -annectdotal evidence from small sequencing tracts
Comparative Genomics To enhance annotation in each species For evolutionary studies: “Genome Archeology” ….
Improving gene calling-Mouse VS. Human revealed missed annotations Mouse Chromosome 16 - All Genes 1053 genes (1060 proteins) 867 proteins with some ‘match’ in human 186 proteins with NO human protein matches For the 186 mouse proteins without any human hit: 131 Of their transcripts hit human transcripts (tblastx) and/or human Genomic (tblastx) (>1/2 significantly) 55 Hit nothing in human (tblastx) Combining with positional information will allow us to suggest: -Cases of failure to call a proper translation -Cases of failure to call a gene -Ultimately: Hs-specific and Mm-specific genes
Genes can be located by linkage analysis – on genetic map **AND by physical methods - on physical map With random mutagenesis, if insertion elements are used (retroviruses or transposons), they: create a mutant phenotype provide a molecular TAG recover genomic DNA with insertion (TAG): by library by plasmid rescue by inverse pcr
RNAi for every C. elegans gene! -results on the web Projects to systematically Knock-out (or pseudo-knockout) every gene, in order to establish phenotype of each gene -> function of each gene
KNOCK-OUTS OF ALL ESSENTIAL GENES – RANDOM MUTAGENESIS ATTEMPT – using transposon mobilization Followed by INVERSE PCR to recover seqeunce adjacent to insertion. Then compare to the complete Drosophila genome sequence to know which ORF “Hit”
STUDYING GENE EXPRESSION AND FUNCTION, PART I Recovering disrupted gene by Inverse PCR method. -example from P element transposon integrated into (disrupting) a Drosophila gene
About 10% of All Assumed genes “Hit” (~10/100 per interval) on Drosophila X chromosome. 1 series of random insertion experiments.ALL inset sites know, thanks to INVERSE PCR
HIP: Rapidly test context options for using cDNA inserts from “Bank” Enables High-Throughput Functional Assays
HIP: Rapidly check different activities of protein from cDNA inserts from “Bank” Building layers of information about proteins Localization Interactors Assay #1 Assay #2 Assay #3 Purification method
2-hybrid reaction between one protein and all 6000+ potential interactors in Yeast Genome Figure 1 The two-hybrid assay carried out by screening a protein array. a, The array of 6,000 haploid yeast transformants plated on medium lacking leucine, which allows growth of all transformants. Each transformant expresses one of the yeast ORFs expressed as a fusion to the Gal4 activation domain. b, Two-hybrid positives from a screen of the array with a Gal4 DNA-binding domain fusion of the Pcf11 protein, a component of the pre-mRNA cleavage and polyadenylation factor IA, which also consists of four other polypeptides36. Diploid colonies are shown after two weeks of growth on medium lacking tryptophan, leucine and histidine and supplemented with 3 mM 3-amino-1,2,4-triazole, thus allowing growth only of cells that express the HIS3 two-hybrid reporter gene. Three other components of factor IA, Rna14, Rna15 and Clp1, were identified as Pcf11 interactors. Positives that do not appear in Table 2 were either not reproducible or are false positives that occurred in many screens.
Osprey: integrate all 2-hybrid interactions between all 6000+ proteins in Yeast Genome (Proteome) Figure 2 Visualization of combined, large-scale interaction data sets in yeast. A total of 14,000 physical interactions obtained from the GRID database were represented with the Osprey network visualization system (see http://biodata.mshri.on.ca/grid). Each edge in the graph represents an interaction between nodes, which are coloured according to Gene Ontology (GO) functional annotation. Highly connected complexes within the data set, shown at the perimeter of the central mass, are built from nodes that share at least three interactions within other complex members. The complete graph contains 4,543 nodes of 6,000 proteins encoded by the yeast genome, 12,843 interactions and an average connectivity of 2.82 per node. The 20 highly connected complexes contain 340 genes, 1,835 connections and an average connectivity of 5.39
A TAP-Isolated complex and its diagramed components, from a Yeast example
From TAP experiments: another integrteion of yeast protein interactions Figure 4 The protein complex network, and grouping of connected complexes.
Look for biochemical activity among all 6000+ coding regions of yeast Pool of yeast GST-fusion proteins From all 96 wells: pool of whole plate’s proteins-Do this for 64 microtiter plates of expressed cDNAs, and all yeast ORFs are covered
Produce all 6000 yeast Proteins as GST-X fusions in 64 X 96-well microtitre plates Guilt-by-activity (biochemical) • Figure 1. Genomic assay of GST-ORF pools. • Transfer RNA ligase activity. • (B) 2'-phosphotransferase activity.
Deconvolute pool with minimal number of reactions Figure 3. Association of YGR247w with CPDase activity. (A) Deconvolution of CPDase from pool 4 implicates YGR247w. GST-ORFs prepared from rows and columns of strains on microtiter plate 4 and from MRM 319 (position C7) were assayed for CPDase. (B) CPDase is associated with YGR247w during conventional purification.
Deconvolute pool with minimal number of reactions 1 Column 1 pool Column 7 pool 12 H A Also collect pools by row, and test