Download
1 / 6
141 likes | 1.12k Views
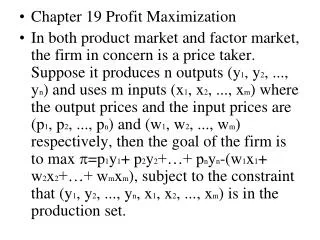
Profit Maximization. We assume the goal of a firm is to maximize its profit. To do so it will have to decide what level of output the produce. We look at some general details here. Revenues and costs. Profit = TR-TC 13 25 31 31 25 13 -5.

E N D
Profit Maximization We assume the goal of a firm is to maximize its profit. To do so it will have to decide what level of output the produce. We look at some general details here.
Revenues and costs Profit = TR-TC 13 25 31 31 25 13 -5 • Q P TR MR AR • 22 22 22 22 • 20 40 18 20 • 18 54 14 18 • 16 64 10 16 • 14 70 6 14 • 12 72 2 12 • 10 70 -2 7 TFC TVC TC MC 5 4 9 4 5 10 15 6 5 18 23 8 5 28 33 10 5 40 45 12 5 54 59 14 5 70 75 16
Maximum profit – Method 1 From the table on the previous screen we see that the 3rd and the 4th units have profit = 31. When consecutive units have the same highest profit amounts we will say the firm will produce the larger amount. If a tie, go with the higher amount. Part of the reason for this is some things we do later.
Maximum Profit – Method 2 Another way to look at the maximum profit point is to look at the MR and MC columns. When the MR > MC on a unit the unit has revenue higher than cost and is thus adding to profit, making profit higher. When the MR < MC on a unit the unit has revenue less than cost is thus lowering profit. The nice thing about this method is it helps us see that if changes occur in the world the changes will only change the level of output if the MR or MC schedules change.
MR and MC graph This graph helps us see the profit maximizing level of output – 4 units. $ MC D = AR 1 2 3 4 5 6 7 Q MR
The Equimarginal Principle If an activity is worth pursuing at all, then it should pursued up to the point where the marginal cost equals the marginal revenue (benefit). What we will see more later is that sometimes when the MR = MC the level of profit is so low that it is not even worth producing. This is the one exception to the equimarginal principle.