Download
1 / 45
450 likes | 453 Views
This webpage provides an overview of the techniques and technologies used to detect genetic variation and discover associations with phenotypes. Topics covered include array-based technologies, whole-genome sequencing, and genome-wide association studies (GWAS). The page also explains how to test single nucleotide polymorphisms (SNPs) for association and correct for multiple testing.

E N D
Inferring Genetic Variation and Discovering Associations with Phenotypes BMI/CS 776 www.biostat.wisc.edu/bmi776/ Spring 2018 Anthony Gitter gitter@biostat.wisc.edu These slides, excluding third-party material, are licensed under CC BY-NC 4.0 by Mark Craven, Colin Dewey, and Anthony Gitter
Outline • Variation detection • Array technologies • Whole-genome sequencing • Genome-wide association study (GWAS) basics • Testing SNPs for association • Correcting for multiple-testing
Variation detecting technologies Affymetrix SNP chip IlluminaHiSeq sequencer • Array-based technologies • Relies on hybridization of sample DNA to pre-specified probes • Each probe is chosen to measure a single possible variant: SNP, CNV, etc. • Sequencing-based technologies • Whole-genome shotgun sequence, usually at low coverage (e.g., 4-8x) • Align reads to reference genome: mismatches, indels, etc. indicate variations • Long read sequencing
Array-based technologies • Currently two major players • Affymetrix Genome-Wide Human SNP Arrays • Used for HapMap project, Navigenics service • IlluminaBeadChips • Used by 23andMe, deCODEme services
Affymetrix SNP arrays Fluorescent tag on sample DNA C A T G G G C T A T sample DNA A C C A G A T A C C C G A T A C C G G A T A C C T G A T Probes for one SNP at a known locus Probes for ~900K SNPs Another ~900K probes for CNV analysis Differential hybridization – one probe for each possible SNP allele
IlluminaBeadChips Illumina • OmniExpress+ • ~900K SNPs (700K fixed, 200 custom) • Array with probes immediately adjacent to variant location • Single base extension (like sequencing) to determine base at variant location
Sequencing-based genotyping compute for each genomic position genotype = GA? sequencing error? GATCGTCGCTACGTGCTAG CTCTACGTACGATCGTCGC CGATCATCGCTACGTGCTA TACGATCGTCTCTACGTGC reads CTACGTAAGATCATCGCTA ACGATCATCGCTACGTGCT CGTACGATCGTCGCTACGT reference ACTCTACGTACGATCGTCGCTACGTGCTAGCTAGTCGCAC
Long read sequencing • Pacific Biosciences SMRT • MinIONnanopore • Illumina TruSeqSynthetic • “over 10 Mb of sequences absent from the human GRCh38 reference in each individual”
GWAS jargon Compiled from http://www.nature.com/scitable/definition/allele-48http://www.nature.com/scitable/definition/genotype-234 http://www.nature.com/scitable/definition/haplotype-142http://www.nature.com/scitable/definition/snp-295https://en.wikipedia.org/wiki/Allele http://www.nature.com/nrg/journal/v9/n6/full/nrg2361.htmlhttps://www.snpedia.com/index.php/Glossary Locus - genetic position on a chromosome, and a single base pair position in the context of SNPs SNP - a locus (single base pair) that exhibits variation (polymorphism) in a population Allele (in the context of SNPs) - the alternative forms of a nucleotide at a particular locus Genotype - the pair of alleles at a locus, one paternal and one maternal Heterozygous - the two alleles differ at a locus Homozygous - the two alleles are identical at a locus Genotyped SNP - we have observed the genotype at a particular SNP, e.g. because the SNP is among the 1 million on the SNP array we used Ungenotyped SNP - we have not observed the genotype at a particular locus Causal SNP - a SNP that directly affects the phenotype, e.g. a mutation changes the amino acid sequence of a protein and changes the protein's function in a way that directly affects a biological process Haplotype - a group of SNPs that are inherited jointly from a parent Linkage disequilibrium - alleles at multiple loci that exhibit a dependence (nonrandom association)
GWAS data • N individuals genotyped at M positions • Disease status (or other phenotype) is measured for each individual
GWAS task Given: genotypes and phenotypes of individuals in a population Do: identify which genomic positions are associated with a given phenotype
Can we identify causal SNPs? Genotyped SNP Ungenotyped causal SNP Ungenotyped SNP Haplotype block: interval in which little recombination has been observed Typically only genotype at 1 million sites Humans vary at ~100 million sites Unlikely that an associated SNP is causal Tag SNPs: associated SNPs “tag” blocks of the genome that contain the causal variant
Direct and indirect associations Phenotype indirect association direct association direct association (haplotype block)
SNP imputation 1000 Genomes SNP array Nielsen Nature 2010 Estimate the ungenotyped SNPs using reference haplotypes
Basics of association testing • Test each site individually for association with a statistical test • each site is assigned a p-value for the null hypothesis that the site is not associated with the phenotype • Correct for the fact that we are testing multiple hypotheses
Basic genotype test genotype phenotype Chi-squared test p-value = 4.1e-5 (2 degrees of freedom) Fisher’s Exact Test p-value = 3.4e-5 Assuming binary phenotype (e.g., disease status) Test for significant association with Pearson’s Chi-squared test or Fisher’s Exact Test
Armitage (trend) test Balding Nature Reviews Genetics 2006 TT AT AA Can gain more statistical power if we can assume that probability of trait is linear in the number of one of the alleles
Trend test example genotype phenotype Trend in Proportions test p-value = 8.1e-6 (note that this is a smaller p-value than from the basic genotype test)
GWAS challenges Population structure Interacting variants Multiple testing Interpreting hits
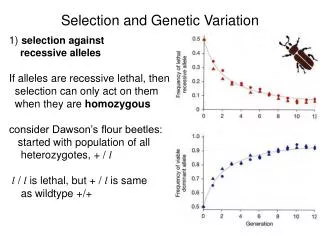
Population structure issues One SNP for N = 40 individuals AA ACTCTACGTAC ACTCTACGTAC Individual with genotype 1 TT ACTCTTCGTAC ACTCTTCGTAC Individual with genotype 2 Balding Nature Reviews Genetics 2006 If certain populations disproportionally represent cases or controls, then spurious associations may be identified
Interacting variants • Most traits are complex: not the result of a single gene or genomic position • Ideally, we’d like to test subsets of variants for associations with traits • But there are a huge number of subsets! • Multiple testing correction will likely result in zero association calls • Area of research • Only test carefully selected subsets • Bayesian version: put prior on subsets
Multiple testing • In the genome-age, we have the ability to perform large numbers of statistical tests simultaneously • SNP associations (~1 million) • Gene differential expression tests (~ 20 thousand) • Do traditional p-value thresholds apply in these cases?
Multiple testing Bennett et al. “Neural correlates of interspecies perspective taking in the post-mortem Atlantic Salmon: An argument for multiple comparisons correction” From Simply Statisticspost on messed up data analyses “One mature Atlantic Salmon (Salmo salar) participated in the fMRI study. The salmon was… not alive at the time of scanning.” “The salmon was shown a series of photographs depicting human individuals… [and] asked to determine what emotion the individual in the photo must have been experiencing.” fMRI to assess changes in brain activity
Multiple testing Bennett et al. “Neural correlates of interspecies perspective taking in the post-mortem Atlantic Salmon: An argument for multiple comparisons correction” t-test finds 16 significant voxels (p < 0.001)
Expression in BRCA1 and BRCA2 Mutation-Positive Tumors • 7 patients with BRCA1 mutation-positive tumors vs. 7 patients with BRCA2 mutation-positive tumors • 5631 genes assayed Hedenfalk et al., New England Journal of Medicine 344:539-548, 2001.
Expression in BRCA1 and BRCA2 Mutation-Positive Tumors • Key question: which genes are differentially expressed in these two sets of tumors? • Methodology: for each gene, use a statistical test to assess the hypothesis that the expression levels differ in the two sets
Hypothesis testing • Consider two competing hypotheses for a given gene • null hypothesis: the expression levels in the first set come from the same distribution as the levels in the second set • alternative hypothesis: they come from different distributions • First calculate a test statistic for these measurements, and then determine its p-value • p-value: the probability of observing a test statistic that is as extreme or more extreme than the one we have, assuming the null hypothesis is true
See how much mass in null distribution with value this extreme or more If test statistic is here, p = 0.034 Calculating a p-value Calculate test statistic (e.g. T statistic) BRAC2 BRAC1 where
Multiple testing problem • If we’re testing one gene, the p-value is a useful measure of whether the variation of the gene’s expression across two groups is significant • Suppose that most genes are not differentially expressed • If we’re testing 5000 genes that don’thave a significant change in their expression (i.e. the null hypothesis holds), we’d still expect about 250 of them to have p-values ≤ 0.05 • Can think of p-value as the false positive rate over null genes
Family-wise error rate • One way to deal with the multiple testing problem is to control the probability of rejecting at least one null hypothesis when all genes are null • This is the family-wise error rate (FWER) • Suppose you tested 5000 null genes and predicted that all genes with p-values ≤ 0.05 were differentially expressed • you are guaranteed to be wrong at least once! • above assumes tests are independent
Bonferroni correction Simplest approach Choose a p-value threshold β such that the FWER is ≤ α where g is the number of genes (tests) For g=5000 and α=0.05 we set a p-value threshold of β=1e-5
Loss of power with FWER • FWER, and Bonferroni in particular, reduce our power to reject null hypotheses • As g gets large, p-value threshold gets very small • For expression analysis, FWER and false positive rate are not really the primary concern • We can live with false positives • We just don’t want too many of them relative to the total number of genes called significant
The False Discovery Rate [Benjamini & Hochberg‘95; Storey & Tibshirani‘02] gene p-value rank C 0.0001 1 F 0.001 2 G 0.016 3 J 0.019 4 I 0.030 5 B 0.052 6 A 0.10 7 D 0.35 8 H 0.51 9 E 0.70 10 • Suppose we pick a threshold, and call genes above this threshold “significant” • The false discovery rate is the expected fraction of these that are mistakenly called significant (i.e. are truly null)
The False Discovery Rate false positives (false discoveries) Storey& TibshiraniPNAS 100(16), 2002 features (genes) total significant at threshold true positives
The False Discovery Rate gene p-value rank C 0.0001 1 F 0.001 2 G 0.016 3 J 0.019 4 I 0.030 5 B 0.052 6 A 0.10 7 D 0.35 8 H 0.51 9 E 0.70 10 # genes t p-value threshold
The False Discovery Rate • To compute the FDR for a threshold t, we need to estimate E[F(t)] and E[S(t)] estimate by the observed S(t) • So how can we estimate E[F(t)]?
Estimating E[F(t)] • Two approaches we’ll consider • Benjamini-Hochberg • Storey-Tibshirani (q-value) • Different assumptions about null features (m0)
Benjamini-Hochberg Suppose the fraction of genes that are truly null is very close to 1 so Then Because p-values are uniformly distributed over [0,1] under the null model Suppose we choose a threshold t and observe that S(t) = k
Benjamini-Hochberg Suppose we want FDR ≤ α Observation:
Benjamini-Hochberg Algorithm to obtain FDR ≤ α Sort the p-values of the genes so that they are in increasing order Select the largest k such that where we use P(k) as the p-value threshold t
What fraction of the genes are truly null? • Consider the p-value histogram from Hedenfalk et al. • includes both null and alternative genes • but we expect null p-values to be uniformly distributed estimated proportion of null p-values expected histogram if all genes were null actual proportion of null p-values Storey& TibshiraniPNAS 100(16), 2002
Storey & Tibshirani approach estimated proportion of null p-values # genes p-value threshold gene p-value rank C 0.0001 1 F 0.001 2 G 0.016 3 J 0.019 4 I 0.030 5 B 0.052 6 A 0.10 7 D 0.35 8 H 0.51 9 E 0.70 10 q-value 0.0010 0.0050 0.0475 0.0475 0.0600 0.0867 0.1430 0.4380 0.5670 0.7000 t pick minimum FDR for all greater thresholds
q-value example for gene J gene p-value rank C 0.0001 1 F 0.001 2 G 0.016 3 J 0.019 4 I 0.030 5 B 0.052 6 A 0.10 7 D 0.35 8 H 0.51 9 E 0.70 10 q-value 0.0010 0.0050 0.0475 0.0475 0.0600 0.0867 0.1430 0.4380 0.5670 0.7000 In this case, already have minimum FDR for all greater thresholds t
q-values vs. p-values for Hedenfalk et al. Storey& TibshiraniPNAS 100(16), 2002
FDR summary • In many high-throughput experiments, we want to know what is different across two sets of conditions/individuals (e.g. which genes are differentially expressed) • Because of the multiple testing problem, p-values may not be so informative in such cases • FDR, however, tells us which fraction of significant features are likely to be null • q-values based on the FDR can be readily computed from p-values (see Storey’s R package qvalue)