Download
1 / 11
110 likes | 254 Views
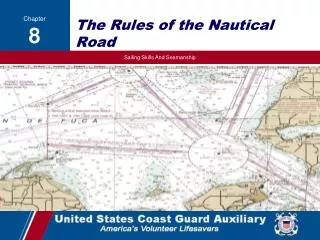
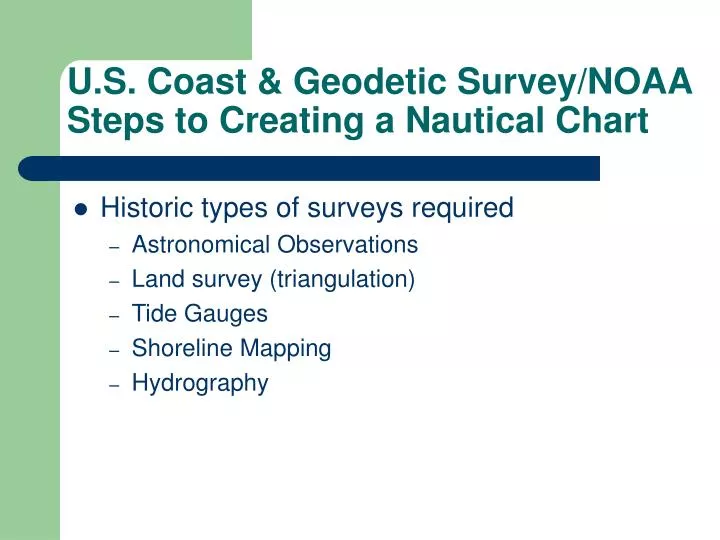
U.S. Coast & Geodetic Survey/NOAA Steps to Creating a Nautical Chart. Historic types of surveys required Astronomical Observations Land survey (triangulation) Tide Gauges Shoreline Mapping Hydrography.

E N D
U.S. Coast & Geodetic Survey/NOAASteps to Creating a Nautical Chart • Historic types of surveys required • Astronomical Observations • Land survey (triangulation) • Tide Gauges • Shoreline Mapping • Hydrography
Theodolite instrument for precise astronomical observations to determine latitude, longitude, and azimuth Astronomical observations were necessary to determine the position and orientation of selected points in a survey network.
View through Telescope at desired star Star aligned with cross-hair
Survey Network Astromical Observations performed at this site to determine initial latitude, longitude, and azimuth.
Angle measured TRIANGULATION Angle measured = survey mark MEASURED BASELINE 1 Angle measured Angle measured MEASURED BASELINE 2 STEPS • Baselines (BL) 1 & 2 are measured • All angles of the triangles are measured • Sides of all triangles are computed • Computed length BL2 is compared to measured length of BL2
=Tide gauge TIDE GAUGES • Tide zone boundaries shown in red and orange • Within each zone tidal height and time correctors are equal • Tidal data required to correct depths and to determine horizontal position of shoreline
Plane table is set-up over known point • Paper map correctly oriented • Distant objects sighted upon and lines drawn from present position toward distant objects • Plane table moved to another location and procedure repeated • Points of intersection define position of distant objects • Shoreline is drawn through intersecting points; also range & bearing determine positions
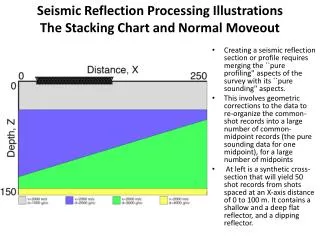
9.1 8.8 8.5 8.3 8 7.9 7.6 7.2 7.2 Depths (soundings) are measured continuously along dotted lines. Sextant angle fixes are taken at locations indicated by green bars. 6 7.2 9.1 9.5 5.1 7 7.9 9.3 9.4 5.7 6.1 8 8.5 7 5 6.5 7.8 8 8.9 5.2 7 9 9.2 6 5.5 7.1 9.2 9.5 8
HYDROGRAPHY • Two sextant angles at periodic points along the launch’s path determine position of the launch
= tide gauge = survey mark GEODETIC SURVEY SHORELINE SURVEY TIDAL SURVEY HYDROGRAPHIC FIELD SHEET FINISHED NAUTICAL CHART