Download
1 / 4
50 likes | 284 Views
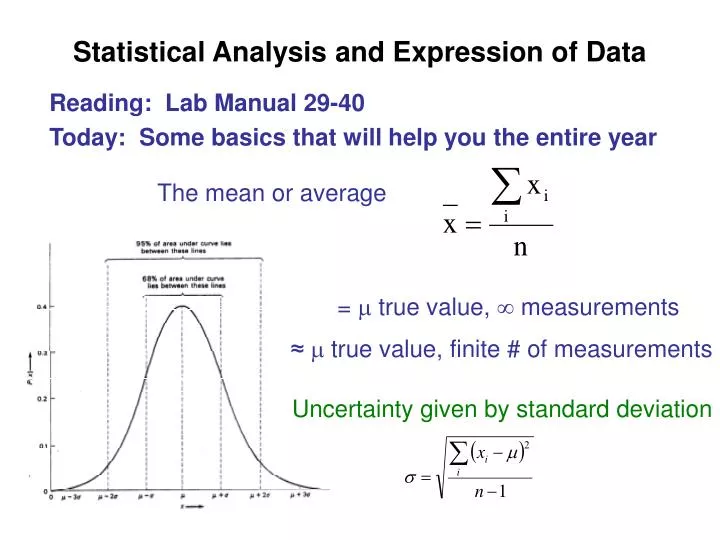
Statistical Analysis and Expression of Data. The mean or average. Reading: Lab Manual 29-40 Today: Some basics that will help you the entire year. = true value, measurements. ≈ true value, finite # of measurements. Uncertainty given by standard deviation.

E N D
Statistical Analysis and Expression of Data The mean or average Reading: Lab Manual 29-40 Today: Some basics that will help you the entire year = true value, measurements ≈ true value, finite # of measurements Uncertainty given by standard deviation
For finite # of measurements Standard deviation: S σ≈ S = [(xi-<x>)2/(n-1)]1/2 Where <x> is average of x (Calculators can calculate <x> & σ quite easily!!! Learn how to do this on your calculator.) For small number of measurements σ≈ S is very poor. Must use Student t value. σ≈ tS; where t is Student t Usually use 95% Confidence Interval So, 95% confident that if we make a measurement of x it will be in the range <x> ± t95s Uncertainty of a SINGLE MEASUREMENT
Usually interested in mean (average) and its uncertainty Standard Deviation of the mean Then average and uncertainty is expressed as <x> ± t95Sm Often want to know how big uncertainty is compared to the mean: Relative Confidence Interval (C.I.) = (Sm / <x>)(t95) Expression of experimental results: 1. Statistical Uncertainties (S, Sm, t95S, Sm (t95) / <x>) always expressed to 2 significant figures 2. Mean (Average) expressed to most significant digit in Sm (the std. dev. of the mean)
Example: Measure 3 masses: 10.5763, 10.7397, 10.4932 grams Average = 10.60307 grams; Std. Dev. S = .125411 = .13 grams Sm = .125411 / 3 = .072406 = .072 grams Then average = ? = 10.60 grams t95 for 3 measurments 95% C.I. = t95Sm = 4.303 * .072406 = .311563 = .31 grams Relative 95% C.I. = ? = 95 % C.I. / Average = .311563/10.60307 = .029384 = .029 Usually expressed at parts per thousands (ppt) = .029 * 1000 parts per thousand = 29 ppt = Relative 95% C.I. What if measure 10.5766, 10.5766, 10.5767 grams? Ave. = 10.57663; Sm = .000033 Ave. = ? Ave. = 10.5766, not 10.57663 because limited by measurement to .0001 grams place Now work problems.