Download

1 / 20
200 likes | 303 Views
Technologies. Energy Analytics Gary Seifert OSIsoft July30, 2013. Measure to Manage. The Power of Data Baseline Patterns Forecast Manage Report. Energy Data Analytics. MONITORING REQUIREMENTS. Facilty. Loads. Metering. Access to Historical?. Baseline vs Actual.

E N D
Technologies Energy Analytics Gary Seifert OSIsoft July30, 2013
Measure to Manage The Power of Data Baseline Patterns Forecast Manage Report
Energy Data Analytics MONITORING REQUIREMENTS • Facilty • Loads • Metering • Access to Historical? Baseline vs Actual... Analyze… Action…
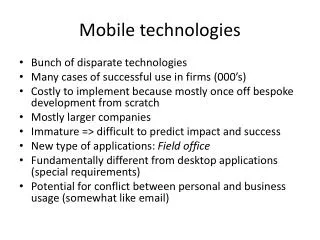
It’s a Changing World Energy Conservation Data Center Consolidation New regulations and goals – Are You Ready? Renewable Energy Metering Green and Sustainable Eliminate Redundancy
Typical Data Sources • SCADA Systems • Building Management systems • Smart Metering Systems • HVAC Systems • Substation Metering, IED – Relaying Systems • Synchrophasers (PMU’s) • Billing and Invoicing Systems • Industrial Control Systems • Historians, • And….
Energy Analytics • Many Types of Analytics – Examples Include • Sky is the Limit – Do What makes sense for you • Pattern Recognition • Develop insight into your system • Detect load and cost creep • Detect anomalies • Develop performance metrics • Develop Key Performance Indicators (KPI) • Track and Plot KPI and real time costs • Automate monitoring, analytics, alarms, reports • Develop awareness and engage the end user • Impact the culture
Visual Tools Time and Events Profile Behavioral Gas Flow Performance Scorecard Geospatial Ad Hoc
Examples from Energy AI Daily Patterns 24/7 Loads Abnormal Loads Holiday Waste http://www.energyai.com/EAIWeb/#
Complex Systems Rich in DATA and Opportunity
University Facilities – University of California, San Diego • Coordination with local utility; hot summer month demand response
Why, a success story? • Case Study at UCSD • Energy Metrics monitored • Actions change behavior and loads • Resulting in RealSavings • Energy and SDGE incentives San Diego Gas & Electric Has Granted $7.2M to UC San Diego Monday, July 29, 2013 San Diego Gas & Electric announced it has given UC San Diego $7.2 million that represents energy efficiency incentives that it earned by implementing 30 energy efficiency projects between 2010 and 2012. UCSD’s efforts in 2010 resulted in a $330,000 award, $2.5 million in 2011 and $4.4 million in 2012. SDG&E said that as a result, UCSD has saved more than 21 million kilowatt hours — the equivalent of removing about 5,000 cars off the road, powering 4,000 homes for a year and preventing the emission of more than 25,000 metric tons of carbon dioxide into the atmosphere. “At UC San Diego, we are dedicated to finding sustainable solutions and it is an honor to have these efforts commended,” Gary C. Matthews, UC San Diego’s vice chancellor for resource management and planning, said in a statement. — SDBJ Staff Report http://sdbj.com/news/2013/jul/29/san-diego-gas-electric-has-granted-72m-uc-san-dieg
Forecasting vs Actual Legend Green – Past 1 year Blue – Past 2 years ago Green – Today’s Loads Purple - Forecast for today This an example of Historian and Forecasting analytics
What is Next Future Trends that will benefit from Energy Analytics: • Increasing Emphasis on Economical Operation • Robust management of unruly or dynamic systems will become the norm for many • Support for new Tariffs (like FERC 775) will change the economics of load management and total energy cost (Becoming part of the Ancillary services to the bulk power system) • Dynamic storage and generation and loads that will enter most areas of the market • EV’s, second life batteries, unexpected solar impacts, etc) • Enhances integration of distributed and renewable energy resources including CHP • Smart Microgrids
Summary • Once aware, management can begin • Quick payback is normal • To manage, know your data, performance indicators and automate monitoring, alarming, and reporting • Develop insight into your system needs, patterns, and performance metrics • Make the steps to engage users, operators, management and make the data and analytical data public and prominent • Take those first steps now, don’t wait. • `It’s ok to take small steps • Do not wait for the home run project • Infuse the culture and see benefits ASAP
Questions?? Gary Seifert EE PE 208-521-8385 gseifert@osisoft.com