Download
1 / 13
130 likes | 139 Views
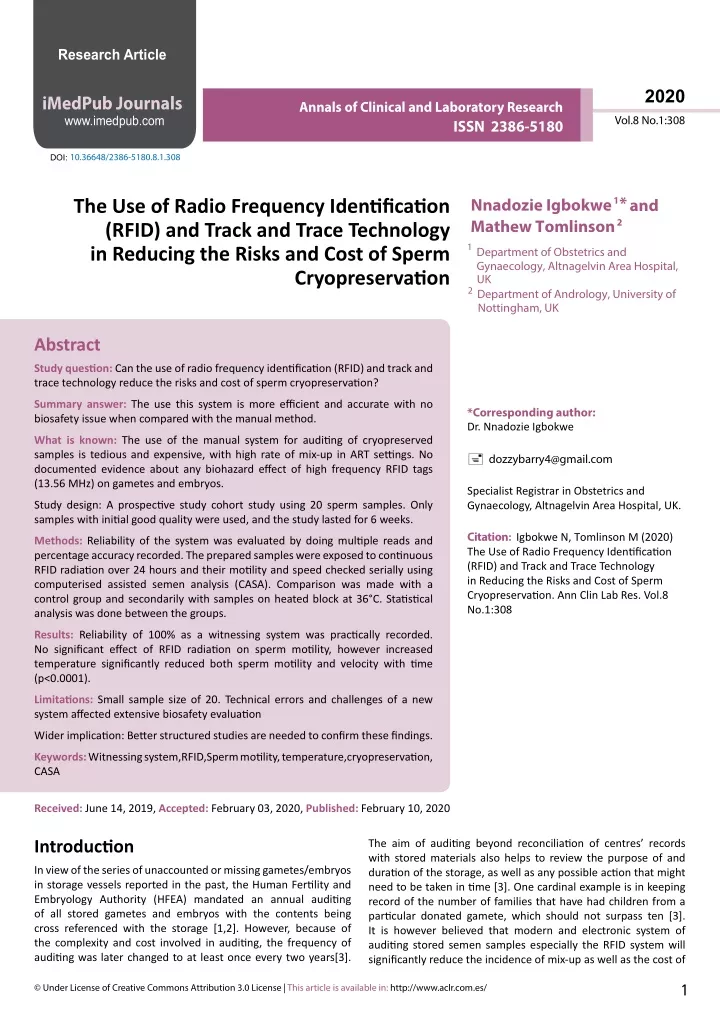
Study question: Can the use of radio frequency identification (RFID) and track and trace technology reduce the risks and cost of sperm cryopreservation? Summary answer: The use this system is more efficient and accurate with no biosafety issue when compared with the manual method. What is known: The use of the manual system for auditing of cryopreserved samples is tedious and expensive, with high rate of mix-up in ART settings. No documented evidence about any biohazard effect of high frequency RFID tags (13.56 MHz) on gametes and embryos. Study design: A prospective study cohort study using 20 sperm samples. Only samples with initial good quality were used, and the study lasted for 6 weeks.

E N D
Research Article 2020 iMedPub Journals www.imedpub.com Annals of Clinical and Laboratory Research Vol.8 No.1:308 ISSN 2386-5180 DOI: 10.36648/2386-5180.8.1.308 * 1 and 2 Nnadozie Igbokwe The Use of Radio Frequency Identification (RFID) and Track and Trace Technology in Reducing the Risks and Cost of Sperm Mathew Tomlinson 1 Department of Obstetrics and Gynaecology, Altnagelvin Area Hospital, 2 Nottingham, UK Cryopreservation UK Department of Andrology, University of Abstract Study question: Can the use of radio frequency identification (RFID) and track and trace technology reduce the risks and cost of sperm cryopreservation? Summary answer: The use this system is more efficient and accurate with no biosafety issue when compared with the manual method. *Corresponding author: Dr. Nnadozie Igbokwe What is known: The use of the manual system for auditing of cryopreserved samples is tedious and expensive, with high rate of mix-up in ART settings. No documented evidence about any biohazard effect of high frequency RFID tags (13.56 MHz) on gametes and embryos. dozzybarry4@gmail.com Specialist Registrar in Obstetrics and Gynaecology, Altnagelvin Area Hospital, UK. Study design: A prospective study cohort study using 20 sperm samples. Only samples with initial good quality were used, and the study lasted for 6 weeks. Citation: Igbokwe N, Tomlinson M (2020) The Use of Radio Frequency Identification (RFID) and Track and Trace Technology in Reducing the Risks and Cost of Sperm Cryopreservation. Ann Clin Lab Res. Vol.8 No.1:308 Methods: Reliability of the system was evaluated by doing multiple reads and percentage accuracy recorded. The prepared samples were exposed to continuous RFID radiation over 24 hours and their motility and speed checked serially using computerised assisted semen analysis (CASA). Comparison was made with a control group and secondarily with samples on heated block at 36°C. Statistical analysis was done between the groups. Results: Reliability of 100% as a witnessing system was practically recorded. No significant effect of RFID radiation on sperm motility, however increased temperature significantly reduced both sperm motility and velocity with time (p<0.0001). Limitations: Small sample size of 20. Technical errors and challenges of a new system affected extensive biosafety evaluation Wider implication: Better structured studies are needed to confirm these findings. Keywords: Witnessing system,RFID,Sperm motility, temperature,cryopreservation, CASA Received: June 14, 2019, Accepted: February 03, 2020, Published: February 10, 2020 Introduction The aim of auditing beyond reconciliation of centres’ records with stored materials also helps to review the purpose of and duration of the storage, as well as any possible action that might need to be taken in time [3]. One cardinal example is in keeping record of the number of families that have had children from a particular donated gamete, which should not surpass ten [3]. It is however believed that modern and electronic system of auditing stored semen samples especially the RFID system will significantly reduce the incidence of mix-up as well as the cost of In view of the series of unaccounted or missing gametes/embryos in storage vessels reported in the past, the Human Fertility and Embryology Authority (HFEA) mandated an annual auditing of all stored gametes and embryos with the contents being cross referenced with the storage [1,2]. However, because of the complexity and cost involved in auditing, the frequency of auditing was later changed to at least once every two years[3]. 1 © Under License of Creative Commons Attribution 3.0 License | This article is available in: http://www.aclr.com.es/
2020 ARCHIVOS DE MEDICINA ISSN 1698-9465 ISSN 2386-5180 Annals of Clinical and Laboratory Research Vol.8 No.1:308 auditing [4,5]. HFEA has granted permission for the introduction of such efficient systems into clinical practice in ART clinics [6]. Materials and Methods RFID system set up Witnessing systems were introduced into the ART services to reduce or prevent the occurrence of mismatching, and could either be manual, electronic or the combination of both. Also two major types of the electronic witnessing system (EWS) are currently in use namely the barcode and the RFID tag systems, and they have the potential to replace manual witnessing [7]. The traditional method of preventing mismatching in IVF clinics has been the manual method which could either be in form of manual double witnessing (MDW) of the proceedings or manual labelling or printed labelling of all the storage materials used in ART processes [5]. Double witnessing in 2002 became mandatory for all IVF procedures in the UK, as the manual witnessing was to found to be a burden and introduces errors inadvertently [8]. The RFID system used for the study was designed by Kustodian Ltd. Middlesex, UK as a maiden model. The system as shown in Figure 1 consists of the following components including the i ball reader (green ball) which assigns new straws to patients for treatment and reads them too. The i ball reader was connected through a transmitting cord to the RFID computer unit (black box) which generates its own Wi-Fi or 4G/3G system (TP-link_8103), and interprets the signals from the i ball reader. The information is then relayed and displayed on laptop computer which is linked to the company’s website, www.kustodian.org through Wi- Fi connection. The second reader called the Dewar or canister reader (MUX or Multiplexer) was connected to the black box, and through six different channels connected to six metallic mini- canisters for assessment in empty Dewar. Three different cryo- tolerant mini-canisters made of fibre glass were also connected (at different times) through a different multiplexer to the black box, and these canisters were used for testing the reliability of the RFID system in liquid nitrogen and vapour phase. It is important to note that notwithstanding the documented limitations of the manual system, the electronic system is not safe-proof, and thus the HFEA has recommended all clinics using the electronic system to still maintain the manual system of labelling as a contingency plan should a system breakdown occur with the electronic system [7]. Although the safety of electromagnetic waves of RFID has been documented, many publications however stated that exposure to such waves alters embryonic and foetal development [9]. The effects however depend on the frequency, exposure time and strength of the electromagnetic waves[9]. Assessment of the integrity of RFID tags provided The first evaluation of the RFID system done was to assess if all the RFID tagged straws provided were functionally ‘active’ when read by the system. A total of 130 RFID tagged straws (Kustodian Ltd. Middlesex, UK) were used for the study; 90 were designed to work in ambient temperature, while the remaining 40 were specifically designed to work in liquid nitrogen (cryo-tolerant tags). Each of the CBS high security straw was attached on its sleeve with a passive, high frequency (13.56 MHz) RFID tag, with a passive distance read of 10-20 cm. The functional integrity of the tags was assessed by putting the straws in groups of five for read or identification inside the i ball reader, and the result displayed on the computer as shown in Figure 2. The i ball reader was configured to read straws in 2 seconds. The effect of the No published study till date has evaluated the longevity of RFID tags in liquid nitrogen, its impact on sperm cells (motility, and velocity) during cryopreservation and the asset detection capability of the RFID reader with straws in different locations. These are the major reasons behind the design of this study, and hopefully will pave way for larger studies that will generate established evidence about RFID and sperm cryobiology. This technology if proven successful, will also save a lot of time spent using the manual method, thereby making the cost of ART service cheaper in the long run, and would boost patients’ confidence against the risk of mismatching or sample loss [10]. RFID system set up. The passive RFID tags on the straws react to the oscillating magnetic field created by the antenna in the I ball reader (green ball) which transmits the information to the central processing unit (CPU) (black box). The information is interpreted and displayed on the computer by the side. The small blue box is the multiplexer (MUX) which reads the straws in the mini-canisters as shown in Figure 1. Figure 1 2 This article is available in: http://www.aclr.com.es/
2020 ARCHIVOS DE MEDICINA ISSN 1698-9465 ISSN 2386-5180 Annals of Clinical and Laboratory Research Vol.8 No.1:308 A- A mini Dewar containing six mini-canisters with RRID antenna ¬connected through channels to the Dewar reader shown in Figure 1 Figure B: The inside of the RFID system CPU showing the mini-computer and processing units with its Wi-Fi system. Figure 2 Evaluation of the functional integrity of the RFID tags. Assessed by placing 5 straws each into the i ball reader, and checking if they were all recognised (‘active’) by the system through the computer. Figure 3 averagely good motility, speed and concentration were needed for the experiment. This was done by pipetting 5 µL of the semen into CellVision counting chamber (CellVision Technologies, The Netherlands), and was assessed using Computer Assisted Sperm Analysis (CASA) (Sperminator v1.0, Procreative diagnostics, UK). Donor’s samples were not used if the parameters (motility, concentration and velocity) were found to be poor. Those with good parameters were prepared using density gradient centrifugation (DGC). position of the tags on the straws was also assessed to see if the reader could detect the straws with the tags at upper, middle or lower parts of the straws, and the percentage of accurate reads recorded. Sample size and semen collection Twenty donors (sample size 20) were used for the experiment, and the semen samples were collected according to the standard operating procedure (SOP) of the Andrology Unit at the Queen’s Medical Centre, Nottingham. Each donor was counselled and consented for his sample to be used for research and teaching purposes only. Semen samples were produced through masturbation into a sterile 60 ml universal container (Alpha Laboratories UK) either on site or from home depending on the distance. Standard laboratory practice was observed as the samples were handled while wearing gloves and laboratory coat. CASA (Computer Assisted Sperm Analysis) The CASA system recorded the motility of the samples as following: grade A progressive motility; grade B reduce progressive motility; grace C non-progressive motility, and grade D immotile in accordance with the WHO pre-2010 guideline. The assessment of motility used for the experiment reflected the post-2010 guideline; hence grades A and B of each sample were added together and recorded as progressive motility (PR) [11]. A screenshot image of a tracked sample with CASA is shown in Figure 3, detailing the various sperm parameters. The CASA system set-up used for the experiment is shown in Figure 4. Preliminary semen analysis and sperm preparation Samples were allowed to liquefy and were analysed within one hour of production. Initial semen analysis was done, as sperm with 3 © Under License of Creative Commons Attribution 3.0 License
2020 ARCHIVOS DE MEDICINA ISSN 1698-9465 ISSN 2386-5180 Annals of Clinical and Laboratory Research Vol.8 No.1:308 Assessment of the effect of RFID waves on sperm motility samples were individually assessed, and the CASA parameters documented. Creation of heated stage control group and ball reader temperature measurement Two groups were created, namely exposure group that was exposed to the RFID electromagnetic waves, and control group in room temperature (average 25°C) without any exposure. The prepared sample was vortexed and about 0.5 ml was loaded into three different RFID tagged straws and both ends sealed with Simms sealer (Symso1, IMV Technologies, France). These straws were the test (exposed) groups, and were labelled T1, T3 and T24 for CASA assessment at 1 hour, 3 hours and 24 hours respectively. The straws were left inside the ball reader which was continuously generating electromagnetic waves on the tagged straws. The control group sample was left in a Falcon tube and kept in a rack at room temperature (25°C) for CASA assessment at the same timing with the exposed group as shown in Figure 5. Semen analysis was done for both groups using the CASA system at time 1 hour, 3 hour and 24 hours respectively, and at each point the corresponding motility and sperm speed were recorded. The 20 In the course of the experiment following analysis of sample 5, it was discovered by serendipity that the straws placed in the ball reader were warmer than those outside. This led to the measurement of the temperature inside the reader using a thermometer for 5 different days including an overnight temperature (Griffin 76 mm immersion thermometer, UK). The average temperature was used to set up a heated stage group using heated block machine (Techne DRI-BLOCK. DB-3A. B2155/8). This was maintained at 36°C, with sperm in Falcon tube in similar fashion to the control group as shown in Figure 6. CASA assessment was done at 1, 3, and 24 hours respectively, and motility and sperm velocity were recorded at each point for the remaining 15 samples. The heated block control was created A standard screenshot output and result of an analysed sperm sample by CASA system (Sperminator v1.0, Procreative Diagnostics, UK). Motility result categorised into percentages in grades A, B, C and D. Average motile speed in microns/sec, and concentration in M/ml. Figure 4 The CASA system set up. From right to left: Compound microscope with heated stage, fitted with Olympus CH30 digital camera on top; the Sperminator display and CPU; and lastly the heated stage machine with used CellVision slides in top. Figure 5 4 This article is available in: http://www.aclr.com.es/
2020 ARCHIVOS DE MEDICINA ISSN 1698-9465 ISSN 2386-5180 Annals of Clinical and Laboratory Research Vol.8 No.1:308 A-The RFID system (Kustodian Ltd. Middlesex, UK), with straws of test group continuously exposed to RFID electromagnetic waves inside the i ball reader (green ball). Figure 6B: Control group sample in Falcon tube at room temperature. Figure 6 A B (A) Temperature in ball reader measured with thermometer (Griffin 76 mm Immersion thermometer, UK). (B) Sperm in Falcon tube placed in Heated block (Techne DRI- Block) to account for effect of temperature as cofounding factor. Figure 7 to account for any possible effect the temperature difference may have on sperm motility. allocated straws each into the six ambient temperature canisters in an empty mini-dewar (i.e. with no liquid nitrogen), as shown in Figure 8. The canisters bearing the RFID straws were read by pressing a button on the multiplexer (canister reader). Each read takes about 15 seconds, with canister one being read for 4 seconds and the rest (canisters 2-6) took 2 second each. With the canisters in their normal allocated positions in the different canisters (inside the Dewar), 100 different reads were done and the percentage accuracy of the system in detecting the straws, their exact position, and the respective patient details were recorded. Secondly, the canisters were moved from their normal positions into another canisters (e.g. straws originally in canister 1 moved to canister 2). This was done to mimic misplaced or floating straws, and once again 100 different reads were done. The reliability and percentage accuracy of the system to detect misplaced straws correctly was recorded as shown in Figure 9. Accuracy/reliability in detecting allocated straws Ten new patients were created in the website and they were all artificially given different names and treatment numbers. Two RFID straws (ambient temperature straws) were assigned to each patient, making a total of twenty straws used. Allocation was done by placing two straws each in the ball reader and clicking the ‘complete’ button against the identity of the respective patient selected for allocation as shown in Figure 7. The allocated straws were then respectively placed back into the ball reader to see if the system could detect them while matching them with the right name and treatment numbers, and the percentage accuracy recorded. Also already allocated straws were place back in the ball reader and effort was made to see if they could be assigned to another patient. In each case, the evaluation was repeated 50 times to assess for reliability and repeatability and the percentage recorded. This was also done to assess the suitability of the system for use as a witnessing system. Assessment of reliability in liquid nitrogen and vapour phase There mini-canisters made of fibre glass with cryo-tolerant circular antennae were used for this phase of the experiment (Figure 10). These were used in conjunction with the cryo-tolerant RFID tagged straws. The methodology was similar to the room temperature canisters. Two to three allocated straws were each Volume and environmental effects on dewar reader The reliability of the system was evaluated by placing two 5 © Under License of Creative Commons Attribution 3.0 License
2020 ARCHIVOS DE MEDICINA ISSN 1698-9465 ISSN 2386-5180 Annals of Clinical and Laboratory Research Vol.8 No.1:308 Detection rate/reliability of allocated straws. Six of the ten patients created shown with their treatment numbers (e.g. Briggs Mark, 874663). Each allocated with 2 straws by hitting the complete button. Accuracy and reliability of the system in detecting already allocated straws against respective patient details was recorded. The system as shown reliably detected the 2 straws (with their RFID tag numbers shown) placed in the ball reader were already allocated to Peter Parker. Figure 8 A B Ambient temperature canisters and audit report. (A) shows the six room temperature canisters used, which were connected through the MUX to the mini-Dewar. The audit report in (B) correctly shows the names of the patient in their respective normal positions in the Dewar, the treatment dates, and the RFID tag numbers of each straw. Figure 9 6 This article is available in: http://www.aclr.com.es/
2020 ARCHIVOS DE MEDICINA ISSN 1698-9465 ISSN 2386-5180 Annals of Clinical and Laboratory Research Vol.8 No.1:308 placed into the three canisters for ‘storage’ as would be done clinically. About 50 ml of liquid nitrogen was added to the mini- Dewar to evaluate for reliability in vapour phase. This amount of nitrogen is small, and the straws in the canisters were in vapour phase. The temperature conductivity potential was evaluated by measuring the temperature on top of the canisters with a thermometer (K-type digital thermometer), and the temperature difference from liquid nitrogen (-196°C) recorded. Fifty reads were done each for the straws in normal allocated positions, and in misplaced positions as shown in Figure 11. Accuracy of the system in correctly identifying the straws locations and respective ‘patient’ details was recorded. readings done for both normal positions and misplaced positions. Each read lasted for 15 seconds also just like the ambient temperature read. The percentage accuracy and reliability were recorded as shown in Figure 12. Statistical analysis Following data collection using Excel sheet, statistical analysis was done using State SE software Version 14. Since the outcomes were all continuous variables for the groups, an unpaired t-test was used for analysis by comparing the sample mean of two groups per time. A value of p<0.05 was statistically significant. The normality of data was checked by using the Anderson-Darling test. Reproducibility of detection was assessed using coefficient of variation where possible. For evaluation in liquid nitrogen, the mini-Dewar was ‘filled’ with nitrogen and the three canisters were totally immersed in it. The evaluation was exactly the same with the vapour phase with 50 Audit of room temperature Dewar (mini Dewar 1): The green colour in all the six mini- canisters indicated they were all accurately identified in their respective positions by the system. A red colour indicates misplaced/floating straws or unallocated straws in the Dewar. Figure 10 B A (A) shows the three fibre glass canisters with cryo-tolerant antennae in circular fashion around them. Figure (B) shows some of the CBS high security straws with cryo-resistant RFID tags used. Figure 11 7 © Under License of Creative Commons Attribution 3.0 License
2020 ARCHIVOS DE MEDICINA ISSN 1698-9465 ISSN 2386-5180 Annals of Clinical and Laboratory Research Vol.8 No.1:308 Reliability of RFID systems in liquid nitrogen. Figure 11B shows the three canisters used which were named 7, 8 and 9 (for canister 1, 2 and 3 respectively). Canister 7 was correctly audited but canisters 8 and 9 showed Dewar problems/error. Figure 12 Results Temperature readings from the ball reader Table 1 Daily temperature recording of the i ball reader. Temperature:mid day(0C) 34 34.5 35 34.5 36 Mean temperature: 36.25°C (34-40.5) Overnight temp (0C) 39 35 37 37 40.5 Days 1 2 3 4 5 The average temperature reading from the i ball reader for the five days was 36°C as seen from Table 1. The overnight temperature reading was generally higher than the mid-day reading, and the temperature range fluctuated between 34 and 40.5°C. Functionality of the RFID tags All the 130 RFID tagged straws used for the study were all active when read with the ball reader giving 100% reliability. Table 2 Accuracy of the RFID system in identifying allocated straws correctly and the percentage of errors or mix-up noticed. Effect of RFID tag position on the straw Patient No No of reads Accuracy/Reliability (%) Mix-up or Errors (%) 0 0 0 0 0 0 0 0 0 0 0% The result of the positional effect of the RFID tags on the straws consistently showed 100% identification when the tags were on the upper or middle parts of the straws in the ball reader. The result was however variable with the tags being on the lower parts of the straws. In essentially 85% of cases, the tags were not read or identified in this lowermost position on the straws. 1 2 3 4 5 6 7 8 9 10 50 50 50 50 50 50 50 50 50 50 100 100 100 100 100 100 100 100 100 100 100% Assessment of reliability Reliability as a witnessing system: All the ten patients allocated with two straws each were correctly identified (with all identifying details shown) by the RFID system when read by the ball reader giving a reliability of 100% as shown in Table 2. The percentage Overall 500 reads 8 This article is available in: http://www.aclr.com.es/
2020 ARCHIVOS DE MEDICINA ISSN 1698-9465 ISSN 2386-5180 Annals of Clinical and Laboratory Research Vol.8 No.1:308 accuracy following 50 repetitions or reads was also 100% for the whole straws. None of the straws could also be re-assigned to other patients following 50 trials each as shown (5 error or mix- up). In total, 500 reads were done, with overall accuracy and reliability of 100%, and no error or mix-up was recorded. Assessment of biosafety Effect of RFID radiation on the speed of sperm Speed: Exposed (test) group and control group: At one hour of continuous exposure to RFID waves, the mean speed of the test sample (T1S) was 47.07 (±3.28) as shown in Table 5. This was 4.01 µ/sec slower than the mean speed of the control sample without exposure, with mean speed of 51.05 (±2.81). The difference however is not statistically significant as the p value stands at 0.358. Reliability in liquid nitrogen/vapour phase: The result of the accuracy and reliability of the RFID system both in empty and storage vessel with liquid nitrogen is shown in Table 3. Starting with an empty storage Dewar (ambient temperature), out of 100 reads done, 97% accuracy was recorded with 3% misread when the straws were in their allocated position in their respective canisters. However, 100% reliability or accuracy was achieved when the straws were moved to wrong positions (‘floating straws’). With the straws in vapour phase and with 100 reads done, 100% accuracy was documented with the straws both in the normal position and in the wrong position respectively. Following 24 hours of continuous exposure, the mean speed of the test sample (T24S) and the control sample (C24S) were 30.02 (±5.41) and 45.73 (±3.49) respectively, with a combined 95% mean confidence interval of 30.95-44.79. The exposed sample was 15.70 µ/sec lower than the control group (mean difference), and the difference is statistically significant at 24 hours (p=0.019). The mean difference in speed between the exposed and control groups increased progressively at 1 hour, 3 hours and 24 hours, and were 4.01, 7.62 and 15.70 respectively. At 3 hours of exposure to RFID, the mean speed of the exposed group (T3S) was 46.23 (±3.99), and 7.69 µ/sec averagely slower than the control group (C3S) with the mean speed of 53.84 (±2.97). The effect at 3 hours however is also not significant (p=0.135). Calculation of radiation dose: Each Dewar reader takes approximately 15 seconds to complete a read. The canister (Dewar) reader each with 6 channels reads all the canisters in two cycles (twice). Canister 1 is read in 2 seconds (total 2 × 2=4); while the remaining 5 canisters are read 1 second each cycle, corresponding to 2 seconds per canister per 2 cycles, and total read time of 10 seconds (5 canisters × 2 seconds each). This in total gives about 15 seconds of time used for reading the Dewar. The number of estimated read per second (exposure frequency to RFID waves) from both the Dewar reader and ball reader is 20 reads or number of exposure per second Table 4. As shown in Table 4, one hour of continuous radiation exposure from the ball reader equals 3,600 seconds (1 × 60 × 60). Three hours of exposure equals 10,800 seconds; while 24 hours of exposure equals 86,400 seconds. The number of corresponding Dewar reads possible after 1 hour of radiation is 900 for canister one (3600/4), and 1800 reads (3600/2) for canisters 2-6. At 3 hours of exposure, number of reads possible for canister one is 2700 and 5400 each for canisters 2 to 6 respectively. The corresponding numbers of reads possible after 24 hours of RFID exposure is 21,600 for canister 1, and 43,000 each for canisters 2-6 respectively. Speed: Exposed (test) group and heated stage group: There was a statistically significant (marginal) effect (p=0.05) of the effect of RFID waves on sperm velocity following 1 hour of exposure when compared with another sample at heated block stage as seen from Table 5. The mean of the speed of the test group (T1S) was 47.03 (±3.27), being 9.53 µ/sec slower than the mean of the heated block stage (H1S) at 36°C which was 56.56 (±3.22). However, at 3 hours of exposure between these two groups, there is no statistical significance of the radiation effect (p=0.193); even though the mean speed of the heated stage sample (H3S) was 7.43 µ/sec (mean difference) greater than the mean of the exposed sample (T3S) which was 46.23 (±3.99) µ/ sec. At 24 hours of exposure, the mean speed of the exposed sample T24S was 30.02 (±5.41) µ/sec, and was greater than that of the heated stage (H24S), which was 23.85 (±2.54) µ/sec. At the first and third hour, the mean speed of the exposed sample was Table 3 Shows accuracy and reliability of the RFID system in different Dewar types including empty Dewar, Vapour Phase, and Liquid nitrogen phase storage. (NB: Data for liquid nitrogen phase unavailable -system failure). Dewar type Ambient Temperature Ambient Temperature Vapour Phase Vapour Phase Liquid Nitrogen Liquid Nitrogen Straw position in canister Normal Floating/wrong Normal Floating/wrong - - Number of reads 100 100 100 100 - - % misread 3 0 0 0 - - % accuracy 97 100 100 100 - - Table 4 Hours of RFID exposure and equivalent number of reads possible. (Number of Dewar read possible = hours in seconds/no of seconds used in reading each canister). Hours 1 3 24 Seconds 3,600 10,800 86400 No of dewar reads possible 900: Canister 1 1800:Canister 2-6 2700: Canister 1 5400: Canisters 2-6 21,600: Canister 1 43,200: Canister 2-6 Actual no of RFID exposure/reads 72,000 (3600 × 20) 216,000 (10,800 × 20) 1,728,000 (86400 × 20) 9 This article is available in: http://www.aclr.com.es/
2020 ARCHIVOS DE MEDICINA ISSN 1698-9465 ISSN 2386-5180 Annals of Clinical and Laboratory Research Vol.8 No.1:308 Table 5 Result of unpaired t test of the effect of RFID waves on sperm’s speed (S). T=test group, C=control group (room temperature), H=heated stage group (at 360°C) and S=sperm speed in microns/second. The numbers 1, 3 and 24 correspond to CASA at 1hr, 3hrs, and 24hrs respectively. SEM=standard error of the mean, and CI=confidence interval. Variable (speed) T1S C1S T3S C3S T24S C24S T1S H1S T3S H3S T24S H24S Mean (µ/sec) 47.03 51.05 46.23 53.84 30.02 45.73 47.03 56.56 46.23 53.66 30.02 23.85 SEM 3.28 2.81 3.99 2.97 5.41 3.49 3.27 3.22 3.99 3.67 5.41 2.54 Mean diff 4.01 - 7.62 - 15.7 - 9.53 - 7.43 - 6.16 - P-value 0.358 - 0.135 - 0.019 - 0.05 - 0.193 - 0.36 - 95% CI 44.69-53.39 - 44.91-55.16 - 30.95-44.79 - 46.18-56.05 - 43.71-55.11 - 20.70-34.04 - Table 6 Result of unpaired t test of the effect of RFID waves on sperm’s speed (S). T=test group, C=control group (room temperature), H=heated stage group (at 360°C) and S=sperm speed in microns/second. The numbers 1, 3 and 24 correspond to CASA at 1hr, 3hrs, and 24hrs respectively. SEM=standard error of the mean, and CI=confidence interval. Variable.motility(pr) T1PR C1PR T3PR C3PR T24PR C24PR T1PR H1PR T3PR H3PR T24PR H24PR Mean (%) 48.18 60.83 37.6 58.98 8.49 46.65 48.18 62.12 37.59 53.95 8.49 13.07 SEM 5.35 3.81 5.89 4.09 2.2 4.46 5.35 4.44 5.89 4.15 2.19 2.16 Mean diff 12.66 - 21.39 - 38.16 - 13.95 - 16.36 - 4.57 - P-value 0.06 - 0.005 - 0 - 0.064 - 0.041 - 0.157 - 95% CI 47.63-61.38 - 40.33-56.24 - 19.64-35.50 - 46.54-61.76 - 36.47-52.74 - 7.23-13.68 - reduced to 8.49 (±2.20) %, against the value of 46.65 (±4.46) % for the control group (C24PR). The mean difference of 38.16% between the two groups at 24 hours was very statistically significant (p < 0.001). found to be lower than that of the heated stage judging from the mean values. However following 24 hours of exposure, the mean velocity of the exposed sample was 6.16 µ/sec (mean difference) higher than the heated stage block, although this difference was not statistically significant (p=0.360). Exposed group and heated stage group: The result of the analysis between these two groups is shown in the lower half of Table 6. At one hour of RFID radiation exposure, the mean motility of the test group (T1PR) was 48.18 (±5.35) %. This value was 13.95% (mean difference) lower than the mean motility of the heated stage group (H1PR), which was 62.12 (±4.4) %. The difference however was not statistically significant as the p value was 0.064 (p >0.05). However, after 3 hours of RFID exposure, there was a statistically significant (p <0.05) decrease in the mean motility difference, which was 16.36% lower in the exposed group. The mean motility of the exposed group (T3PR) was 37.59 (±5.89) % against 53.95 (±4.15) % for the heated stage group (H3PR) respectively. The mean motility of the exposed sample (T24PR) after 24 hours of RFID radiation, was 4.57% lower than that of the heated stage group (H24PR), even though the difference was not statistically significant (p <0.157). The mean motility of the exposed sample at 24 hours was 8.49 (±2.19) %, against the value of 13.07 (±2.16) % for the heated stage group respectively. Effect of RFID radiation on motility Exposed group and control group: The effect of RFID waves on the motility of sperm was evaluated by doing an independent t test on the data obtained between the test (exposed) group (T) and the control group (C); and between the test group and the heated stage (H) group, as shown in Table 6. The exposed group (T1PR) had a lower mean motility of 48.18 (±5.35) % following one hour of RFID radiation, against the value of 60.83 (±3.81) % for the control group (C1PR). The mean difference in motility between both groups was 12.66%, but this was not statistically significant (p=0.06). After 3 hours of exposure to RFID waves, the mean motility of the exposed sample (T3PR) was 37.60 (±5.89) %, being 21.39% (mean difference) lower than the mean motility of the control group (C3PR), which was 58.98 (±4.09) %. This difference at 3 hours was statistically significant (p < 0.05). The mean motility of the exposed group at 24 hours (T24PR) further 10 This article is available in: http://www.aclr.com.es/
2020 ARCHIVOS DE MEDICINA ISSN 1698-9465 ISSN 2386-5180 Annals of Clinical and Laboratory Research Vol.8 No.1:308 Effect of temperature on sperm motility and speed second half of Table 7. The mean motility of the heated stage sample (H1PR) after one hour was 62.13 (±4.44) %, against 60.83 (±3.81) % for the control sample (C1PR) respectively. The mean difference of 1.30% was not statistically significant (p= 0.826. Following 3 hours of being on the heated block, the mean motility of the sample (H3PR) was 53.95 (±4.14) %, and comparatively lower than that of the control sample (C3PR) which was 58.98 (±4.09) %. The mean difference of 5.03% between the two groups however was not statistically significant (p= 0.403). At 24 hours, the mean motility of the heated sample (H24PR) became 33.58% (mean difference) less motile than the control group (C24PR) which was very statistically significant (p< 0.001). Effect on speed: Heated stage group and control group: The possible effect of temperature on sperm motility and speed was evaluated between the control and the heated stage groups, and the results presented in Table 7. After one hour on heated block at 36°C, the mean speed of the heated stage sample (H1S) was 5.52 micron/second (mean difference) greater than the control sample (C1S) at room temperature. The difference however was not statistically significant (p = 0.205). At 3 hours of exposure to increased temperature, the mean speed of the heated group (H3S) was 56.36 ±3.67 µ/sec. This was 0.18 µ/sec (mean difference) lower than the mean speed of the control sample which was 53.85 (±2.98) µ/sec, but without being statistically significant (p=0.969). At 24 hours, the mean speed of the heated block sample was 23.85 (±2.54) µ/sec, against the mean value of 45.73 (±3.50) µ/sec for the control group respectively. The mean difference of 21.87 µ/sec between the two groups at 24 hours is very statistically significant (p<0.001). Analysis of motility index (MI) A new parameter called MI was created in order to have a good correlation of the effect of RFID radiation on sperm quality. The formula used was: MI = speed (S) X progressive motility (PR)/100. The MI of each group was calculated, and correlated with one another. The group bar chart in Figure 13 shows the three experimental groups and their corresponding mean motility indices, as well as their error bars. The MI of the test group at Effect on motility: Heated stage group and control group: The effect of temperature on sperm motility is still shown in the Table 7 Result of unpaired t test of the effect of temperature on sperm progressive motility (PR) and speed (S). C=control group (room temperature), H=heated stage group (at 360°C). Variable:(speed) H1S C1S H3S C3S H24S C24S Variable:motility(pr) H1PR C1PR H3PR C3PR H24PR C24PR Mean (µ/sec) 56.57 51.05 53.67 53.85 23.85 45.73 Mean (%) 62.13 60.83 53.95 58.98 13.07 46.64 SEM 3.22 2.8 3.67 2.98 2.54 3.5 SEM 4.44 3.81 4.14 4.09 2.16 4.46 Mean diff 5.52 - 0.18 - 21.87 - Mean diff 1.3 - 5.03 - 33.58 - P-value 0.205 - 0.969 - 0 - P-value 0.826 - 0.403 - 0 - Combined 95% CI 49.07-57.76 - 49.12-58.40 - 30.43-42.27 - Combined 95% CI 55.59- 67.18 - 50.88-62.77 - 24.31- 40.20 - 45 40 35 mean motility index (MI) 30 25 20 15 10 5 0 1 -5 T1MI T3MI T24MI H1MI H3MI H24MI C1MI C3MI C24MI Bar chart showing the mean motility index (MI) of the various experimental groups with their error bars on top corresponding to their SEM (standard error of the mean). The horizontal labelling shows the test group first (T), heated stage group (H) at the middle, and then control sample (C). Figure 13 11 © Under License of Creative Commons Attribution 3.0 License
2020 ARCHIVOS DE MEDICINA ISSN 1698-9465 ISSN 2386-5180 Annals of Clinical and Laboratory Research Vol.8 No.1:308 first hour was the lowest among the three groups, followed by the control sample, with the heated stage having the highest value at 1 hour. The mean MI of the control (C3MI) at 3 hours however increased more than the 1 hour value, while that of the test group (T3MI), and the heated stage group (H3MI) reduced proportionately. At 24 hours, the mean MI of the control group (C34MI) showed no drastic difference (marginal reduction), whereas that of the heated stage (H24MI) reduced drastically from initial value of about 26 to mean MI of about 4, with a very wide error bar. The lowest mean MI at 24 hours however was that of the exposed sample which was about 3. The error bars of the test group distinctively were much lower than those of the control and heated stage groups respectively. average temperature of 36°C generated by the ball reader, there was no statistical significance seen in the mean speed between the two. This shows that the significant reduction seen between the exposed and the control groups was due to the temperature effect of the ball reader, and not from the RFID radiation. The effect of increased temperature in reducing the motility and viability of sperm is extensively recorded in the literature, with a particular study showing a 50% significant reduction in sperm motility after 12 hours of incubation at 37°C [12]. This finding is in keeping with the result in Table 6 which shows a statistically significant decline (p=0.005) in the mean motility of test group against the control sample at 3 hours, with a mean difference of 21.39. The motility further significantly deteriorated at 24 hours of exposure against the control group (mean difference 38.16, p<0.0001). However in contrast, in order to show that the reduction in motility seen with the exposed group above is not necessarily from the effect of RFID radiation, the comparison of the heated stage and the test groups showed no statistical significance in 1 hour, and 24 hours respectively as shown in Table 7. The significant difference seen at 3 hours (p=0.041) could majorly be due to the fluctuation seen with the temperature reading of the ball reader with an upper limit of 40.5°C. It would thus be expected for samples that were randomly exposed in the ball reader at temperature of 38°C and above to have lower mean motility against the heated stage group which was maintained at 36°C. Effect of temperature and radiation on MI The result shown in Table 8 compared the MI of the test group and heated stage group together to see if there is any difference with statistical significance. From the table, the mean MI of the test group was always lower than the heated stage group (1 hr, 3 hrs and 24 hrs). At one hour, the mean MI was 24.51 for the test group (TMI1), while that heated stage was 35.69. The mean difference which was 11.18 lower for the test group was statistically significant (p< 0.05). The mean MI at 3 hours for the test group (TMI3) was 20.43, being 8.69 lower than the MI of the heated stage group (H3MI) which was 29.12. The difference however was not statistically significant (p=0.103). At 24 hours of exposure, the difference in the mean MI between the two groups was 1.15, with no statistical significance (p=0.22). The mean MI of the heated group and the test groups were 3.46 and 2.32 respectively at 24 hours. The sample sizes of both groups however were not the same; it was 20 for the exposed group and 15 for the heated stage group. This study in addition provided clear evidence that incubating sperm in increased temperature with time progressively decreases both the speed and motility of the sperm in a statistically significant proportion as shown in Table 8. The implication of this is that increased temperature initially increases sperm motility and velocity but subsequently, a reverse pattern is seen with progressive deterioration in these parameters. This is evident from this study, where both the mean velocity and mean motility of the heated sample were 21.87 and 33.58 lower than that of the control group at 24 hours respectively, with both having a very statistical significance (p<0.001). These findings are in keeping with other publications which found no statically significant difference in sperm motility at the first few hours of incubation at body temperature, but with a statistically significant reduction at 24 hours [13]. Discussion Biosafety issues The result from this study about the effect of RFID on sperm motility and velocity is guarded, but overall showed no statistical significance. This means that the result obtained when the exposed group was compared with the control group should not be interpreted in isolation, as the heated component of the ball reader antenna which increased the temperature of the test group in the range of 34-40.5°C significantly contributed to the poor outcome seen with the exposed group. From Table 5, there was a statistically significant reduction in the mean speed of the exposed sample only at 24 hours against the control group (mean difference 15.70, p=0.019). However, when the exposed group was compared with the heated stage group maintained at the Limitations and Future Work One of the major limitations of this study is the small sample size of 20 used. A larger sample size would have made any effect of RF radiation on sperm motility and speed to be more objectively assessed. The effect of sample size also became an issue of Table 8. Result of unpaired t test between the test and heated stage groups using the mean motility index (MI). The numbers 1, 3 and 24 correspond to MI at 1hr, 3hrs, and 24hrs respectively. Motility index TMI1 H1MI TMI3 H3MI TMI24 H24MI Sample size 20 15 20 15 20 15 Mean 24.51 35.69 20.43 29.12 2.32 3.46 Mean diff 11.18 - 8.69 - 1.15 - P-value 0.04 - 0.103 - 0.22 - 95% ci 23.71-4.88 - 18.80-9.51 - 1.88-3.74 - 12 This article is available in: http://www.aclr.com.es/
2020 ARCHIVOS DE MEDICINA ISSN 1698-9465 ISSN 2386-5180 Annals of Clinical and Laboratory Research Vol.8 No.1:308 concern as the sample size of the heated stage was 15 against the original sample size of 20 for both the exposed and control groups. This could have tilted the result obtained from the study. Another important limitation that was unexpected was the temperature effect generated from the ball reader which prevented direct and a more accurate comparison of the effect of RF radiation between the exposed and the control groups. The company that manufactured the RFID system evaluated were not thoroughly done with all facets of the design as at the point of this study and this could partly explain the hardware and software problems that occurred with the canisters in liquid nitrogen. Although the total read of 500 was used to assess the reliability of the system with regards to mix-ups, a more extensive and prolonged number of reads and evaluation would give more confidence about the reliability and accuracy of the system reassuring reproducible accuracy when the system was evaluated for its use both in an empty Dewar and in vapour phase nitrogen for sperm cryopreservation. However, a reader failure occurred during the assessment in liquid nitrogen due to hardware and software issues. With regards to biosafety of the RF radiation, no direct negative reduction in sperm motility and velocity was noticed. The marginal reduction seen was arguably due to the heat (temperature effect) generated by the ball reader as it was left on throughout the study. Besides, in clinical practice, no negative effect would also be expected as samples are only exposed to the RFID EMR just for few seconds against the continuous exposure done in this study. A clear negative correlation between increased temperature and sperm motility and speed with progressive statistical significance over time was also noticed. This is in keeping with other findings in the literature and proved that the reduction in sperm quality seen in the exposed group in this study was due to unsteady temperature rise of the ball reader. There is however an imperative need for more robust studies with larger sample size to be conducted to confirm the findings noted in this study. Conclusion The findings from this study validated the reliability of the track and trace technology of the RFID system for use as an electronic witnessing programme in clinical settings. Also, there was a very References (2015) Traceability of human sperm samples by direct tagging with polysilicon microbarcodes. Reprod Biomed Online 31: 162-170. 1 Human Fertilisation and Embryology Authority (HFEA) (2000) Audit of Stored Sperm, Eggs and Embryos. 8 Thornhill AR, Brunetti XO, Bird S, Bennett K, Rios LM, et al. (2011) Reducing human error in IVF with electronic witnessing. Fertil Steril 96: 179. 2 Gianaroli L, Plachot M, Van Kooij R, Al-Hasani S, Dawson K, et al. (2000) ESHRE guidelines for good practice in IVF laboratories. Hum Reprod 15: 2241-2246. 9 Hur YS, Ryu EK, Park SJ, Yoon J, Yoon SH, et al. (2015) Development of a security system for assisted reproductive technology (ART). J Assist Reprod Genet 32: 155-168. 3 Human Fertilisation and Embryology Authority (HFEA) (2008). Code of Practice 8th edition (consultation draft). 10 Roberta Maggiulli, Rienzi L, Ubaldi F (2012) Implementing an electronic witnessing system into a busy IVF clinic – one clinic’s experience. Rome, Italy: Genera Center for Reproductive Medicine. 4 Adams S, Carthey J (2006) IVF witnessing and electronic systems final report. HFEA. 11 Vasan SS (2011) Semen analysis and sperm function tests: How much to test. Indian J Urol 27: 41-48. 5 Brunetti XO, Bird S, Rogers S Thornhill A (2012) Op-2 identifying human error in the IVF laboratory using electronic witnessing. Reprod Biomed Online 24:S1. 12 Appell RA, Evans PR (1977) The effect of temperature on sperm motility and viability. Fertil Steril 28: 1329-1332. 6 Lister C (2006) The Use of Bar Coding and RFID in the IVF Laboratory. Human Fertilisation and Embryology Authority Scientific and Clinical Advances Group. 13 Schuffner A, Morshedi M, Vaamonde D, Duran EH, Oehninger S, et al. (2002) Effect of different incubation conditions on phosphatidylserine externalization and motion parameters of purified fractions of highly motile human spermatozoa. J Androl 23: 194-201. 7 Novo S, Mora-Espi I, Gomez-Martinez R, Barrios L, Ibanez E, et al. 13 © Under License of Creative Commons Attribution 3.0 License