Download
1 / 10
100 likes | 111 Views
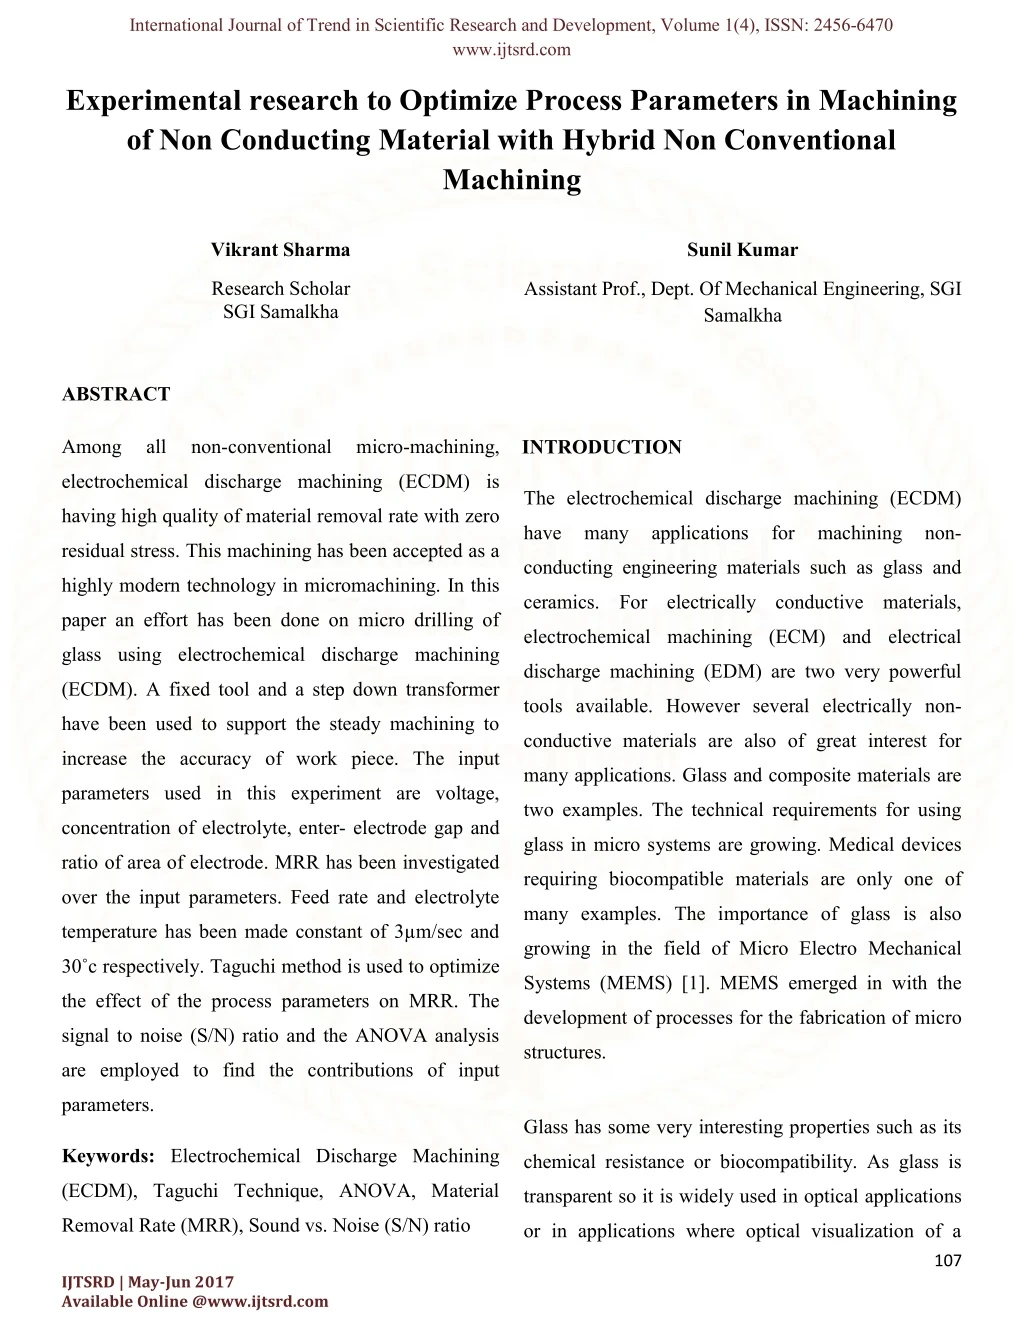
Among all non-conventional micro-machining, electrochemical discharge machining (ECDM) is having high quality of material removal rate with zero residual stress. This machining has been accepted as a highly modern technology in micromachining. In this paper an effort has been done on micro drilling of glass using electrochemical discharge machining (ECDM). A fixed tool and a step down transformer have been used to support the steady machining to increase the accuracy of work piece. The input parameters used in this experiment are voltage, concentration of electrolyte, enter- electrode gap and ratio of area of electrode. MRR has been investigated over the input parameters. Feed rate and electrolyte temperature has been made constant of 3-u00b5m/sec and 30-u00b0c respectively. Taguchi method is used to optimize the effect of the process parameters on MRR. The signal to noise (S/N) ratio and the ANOVA analysis are employed to find the contributions of input parameters. Vikrant Sharma | Sunil Kumar"Experimental research to Optimize Process Parameters in Machining of Non Conducting Material with hybrid non conconventional machining" Published in International Journal of Trend in Scientific Research and Development (ijtsrd), ISSN: 2456-6470, Volume-1 | Issue-4 , June 2017, URL: http://www.ijtsrd.com/papers/ijtsrd84.pdf http://www.ijtsrd.com/engineering/mechanical-engineering/84/experimental-research-to-optimize-process-parameters-in-machining-of-non-conducting-material-with-hybrid-non-conconventional-machining/vikrant-sharma<br>

E N D
International Journal of Trend in Scientific Research and Development, Volume 1(4), ISSN: 2456-6470 www.ijtsrd.com Experimental research to Optimize Process Parameters in Machining of Non Conducting Material with Hybrid Non Conventional Machining Vikrant Sharma Sunil Kumar Research Scholar SGI Samalkha Assistant Prof., Dept. Of Mechanical Engineering, SGI Samalkha ABSTRACT Among all non-conventional micro-machining, INTRODUCTION electrochemical discharge machining (ECDM) is The electrochemical discharge machining (ECDM) having high quality of material removal rate with zero have many applications for machining non- residual stress. This machining has been accepted as a conducting engineering materials such as glass and highly modern technology in micromachining. In this ceramics. For electrically conductive materials, paper an effort has been done on micro drilling of electrochemical machining (ECM) and electrical glass using electrochemical discharge machining discharge machining (EDM) are two very powerful (ECDM). A fixed tool and a step down transformer tools available. However several electrically non- have been used to support the steady machining to conductive materials are also of great interest for increase the accuracy of work piece. The input many applications. Glass and composite materials are parameters used in this experiment are voltage, two examples. The technical requirements for using concentration of electrolyte, enter- electrode gap and glass in micro systems are growing. Medical devices ratio of area of electrode. MRR has been investigated requiring biocompatible materials are only one of over the input parameters. Feed rate and electrolyte many examples. The importance of glass is also temperature has been made constant of 3µm/sec and growing in the field of Micro Electro Mechanical 30˚c respectively. Taguchi method is used to optimize Systems (MEMS) [1]. MEMS emerged in with the the effect of the process parameters on MRR. The development of processes for the fabrication of micro signal to noise (S/N) ratio and the ANOVA analysis structures. are employed to find the contributions of input parameters. Glass has some very interesting properties such as its Keywords: Electrochemical Discharge Machining chemical resistance or biocompatibility. As glass is (ECDM), Taguchi Technique, ANOVA, Material transparent so it is widely used in optical applications Removal Rate (MRR), Sound vs. Noise (S/N) ratio or in applications where optical visualization of a 107 IJTSRD | May-Jun 2017 Available Online @www.ijtsrd.com
International Journal of Trend in Scientific Research and Development, Volume 1(4), ISSN: 2456-6470 www.ijtsrd.com process is needed. Some promising applications for over flexibility and simple procedure of machining, glass in the MEMS field are micro accelerometers, with great capability in micro-machining of non- micro reactors, micro pumps, and medical devices conductive hard brittle materials. such as flow sensors or drug delivery devices. All these applications give birth to the need of effective WHAT IS ECDM? ECDM Electro chemical discharge machining makes and economical machining of glass. use of electrochemical and physical phenomena to To meet this need and industrial requirement of machine glass. The principle is explained in the figure machining of brittle non-conducting materials, studies 1 below are needed to improve the quality characteristics of ECDM process. Thus parametric study has been carried out based on Taguchi method to optimize the machining characteristic MRR (material removal rate) for ECDM process by controlling three important machining parameters, such as applied voltage, electrolyte concentration and inter electrode gap. ECDM has much more applications for machining Figure 1-Schematic View of ECDM Process non- conductive engineering materials like ceramics, fiber glass, etc. Such nonconductive materials have The work piece is dipped in an appropriate huge industries and commercial applications like electrolytic solution usually sodium hydroxide or Complex shaped micro- contours in insulators, potassium hydroxide. A constant DC voltage is Miniature features for turbine blades ( micro-tabulated applied between the machining tool or tool-electrode cooling holes), Filters for food and textile industries, and the counter-electrode. The tool-electrode is Micro fluidic channels in non-conducting materials dipped a few mm in the electrolytic solution and the (quartz, glass and ceramics), truing and dressing of counter-electrode is in general a large flat plate. The metal bonded grinding tools etc. The current need for tool- electrode surface is always significantly smaller every industry is to improve the quality of machining than the counter-electrode surface. The tool-electrode of such non-conductive materials with minimum cost is generally polarized as a cathode, but the opposite so as to compete on market and have maximum profit polarization is also possible. When the cell terminal out of it. To meet these requirements on this particular voltage is lower than a critical value called critical machining process, research works is very much voltage, typically between 20 and 30 V, traditional needed through correct parametric design and electrolysis occurs. [1] optimization technique. ECDM has the advantages 108 IJTSRD | May-Jun 2017 Available Online @www.ijtsrd.com
International Journal of Trend in Scientific Research and Development, Volume 1(4), ISSN: 2456-6470 www.ijtsrd.com Hydrogen gas bubbles are formed at the tool-electrode FABRICATION OF SETUP and oxygen bubbles at the counter-electrode The ECDM setup essentially requires a pulsed DC depending on their polarization and the electrolyte power supply, appropriate tool and auxiliary used. When the terminal voltage is increased, the electrode, electrolyte and its container, work piece current density also increases and more and more fixture and XYZ movement setting. As shown in bubbles are formed. A bubble layer develops around Figure 2 below the electrodes .The density of the bubbles and their mean radius increase with increasing current density. When the terminal voltage is increased above the critical voltage the bubbles coalesce into a gas film around the tool-electrode and produces the discharges between the tool and the surrounding electrolyte. Machining is possible if the tool-electrode is in the near vicinity of the glass sample. During machining the local temperature can increase to such an extent, resulting in heat affected zones or even cracking. The different cathode and anode reaction takes place as Figure 2 soon as an appropriate potential is reached between An AC to DC convertor with specific Voltage output the inter electrode gap of the machining zone[1] range and voltage and current display is utilized as Reactions at the cathode (or tool) power supply with a dimmer to efficiently control the voltage. Electrolyte used is NaOH and is contained in (i) Plating of metal ions M+ + e- → M Where M represents any anode material (ii) Evolution of hydrogen gas. 2H2O + 2e- → 2(OH)- + H2 ↑ Reaction at anode (auxiliary electrode) (i) Dissolution of metal ions in the electrolytic solution M → M+ + e- (ii) Evolution of oxygen gas at the auxiliary electrode 4(OH)- → 2H2O + O2 + 4e- a thick glass container. A spring managed tool of HSS of 0.9 mm diameter is used as tool electrode and is insulated in between by a fabric holder to avoid the rest of machine from circuit current. The table movements of a vertical milling machining is used to provide essential feeds. Work piece is glass with length 76 mm width 26 mm and thickness 1.35 mm .The fixture for holding the glass work piece is made of acrylic. Thus a working set up of ECDM is fabricated. 109 IJTSRD | May-Jun 2017 Available Online @www.ijtsrd.com
International Journal of Trend in Scientific Research and Development, Volume 1(4), ISSN: 2456-6470 www.ijtsrd.com Table 1: Machining parameters Symbols A Machining Parameters Applied voltage V Electrolyte Concentration % Inter Electrode Gap mm Ratio of Area of Electrode Range 30 40 50 25% 35% 45% B 20 40 60 C 1:20 1:40 1:60 D experiment. The amount of material removed is SELECTION OF PROCESS PARAMETERS measured by taking the difference in weight of the In this present experimental work the process work piece before and after the machining W1and W2 parameters are taken as voltage with different levels respectively. The MRR [8] can be calculated by of 40V to 60V, variable concentration of KOH as dividing the difference in weight by machining time electrolyte with 40% to 45% by volume, inter as (W1- W2)/ t . t denotes the machining time. electrode gap of 20mm to 60mm and ratio of area of TAGUCHI METHODOLOGY-BASED DOE electrode with 1:20 to 1:60.In designing the The analysis of experimental results is done by experiments these ranges are applied as in the table1 Taguchi method [7] based parametric optimization below. technique to quantitatively determine the effects of various machining parameters on the MRR quality characteristics of ECDM process and to find the optimum parametric condition for obtaining optimum machining. In this analysis the design of experiment is done based on the selection of an appropriate standard orthogonal array. The analyses of signal-to-noise S/N ratio and Pooled ANOVA [6] is carried out to study the relative importance of the machining parameters on MRR of ECDM process for machining non-conducting material glass and their respective contribution for machining is MEASUREMENT OF PERFORMANCE obtained. Based on this analysis the optimal setting Experiments are conducted according to the design of for the machining parameters for MRR is obtained. experiment and responses are measured for each 110 IJTSRD | May-Jun 2017 Available Online @www.ijtsrd.com
International Journal of Trend in Scientific Research and Development, Volume 1(4), ISSN: 2456-6470 www.ijtsrd.com SELECTION OF ORTHOGONAL ARRAY Before selecting an orthogonal array for the ? ???1/R2) S/N ratio = -10* log10(? experiment the total degrees-of-freedom [6] DOF for ?∑ the experiments is to be calculated. The applied voltage, electrolyte concentration, inter electrode gap Where and Ratio of area of Electrode are the three factors and each factor has three levels. After calculating the m is the number of replications total DOF of experiment the next is to select an orthogonal array. The standard orthogonal array R is the value of MRR of ith replication test for jth experimental condition. which has at least three number of columns at three levels is L9 [6] is thus selected. This array has total eight DOF and it can handle four three-level Material removal rate is the main response which has machining parameters. Each machining parameter can to be taken seriously and has to be analyze carefully. be assigned to a column and nine machining It is defined as the total amount of material removed parameter combinations are available in L9. Thus only from the work piece per unit time after undergoing nine experiments are required to be conducted to machining process. It is calculated as the difference study the effects of machining parameters on the of initial weight before machining to the final weight performance of ECDM process. after machining of the work piece divided by total time taken to remove that amount of material. ANALYSIS OF S/N RATIO RESULTS AND DISCUSSION In Taguchi method S/N ratio [7] is used to measure the quality characteristics deviation from the desired value. The term signal represents the desirable mean The Experiments are carried out as accordance to the value of the output response and the term noise designed DOE and all the nine combination of the represent the undesirable value the standard deviation conditions are repeated three times each. The result for the output response. In present study to optimize obtained and the calculated S/N ratio is indicated in the machining performance the larger the better the table2 below quality characteristics for MRR is considered. The S/N ratio for MRR, for jth experiment is defined as 111 IJTSRD | May-Jun 2017 Available Online @www.ijtsrd.com
International Journal of Trend in Scientific Research and Development, Volume 1(4), ISSN: 2456-6470 www.ijtsrd.com Table 2: DOE and results for MRR and S/N ratio Design of Experiments Applied Voltage V A Electrolyte Concentration % B Inter Electrode gap C Ratio of Area of Electrode 1:20 Expt No. J MRR mg/min R2j S/N Ratio 0.068 R1j 1.018 1.002 1.004 R3j 1:40 1 30 25 20 1:60 1.002 1.364 1.366 2.713 2 30 35 40 1:60 1.004 1.434 1.428 3.126 3 30 45 60 1.364 1.738 1.762 1:20 1.37 1.55 1.526 3.738 4 40 25 40 1:40 4.860 5 40 35 60 1:40 1.366 2.338 2.336 7.389 6 40 45 20 1:60 1.438 2.464 2.46 7.821 7 50 25 60 1:20 1.434 2.79 2.798 8.926 8 50 35 20 1:20 1.428 2.95 2.962 9.423 9 50 45 40 L2-L1 is the effect occurs when corresponding parameter value changes from level 1 to level 2. L3- L2 is the effect occurs when the corresponding parameters value changes from level 2 to level 3. Table.3: Value of Process Parameters at Different Level LEVEL VOLTAGE CONC.OF ELECTROLYTE INTER- RATIO OF AREA OF ELECTRODE ELECTRODE GAP S/N Raw S/N Raw S/N Raw S/N Raw data 1.97 5.33 8.72 3.36 data 1.27 1.88 2.74 0.61 data 5.46 5.29 5.27 -0.17 data 2.05 1.95 1.88 -0.09 data 4.78 5.97 5.26 1.19 data 1.91 2.06 1.92 0.15 data 3.88 5.50 6.65 1.62 data 1.67 1.97 2.24 0.30 L1 L2 L3 L2-L1 L3-L2 3.39 0.86 -0.02 -0.07 -0.71 -0.13 1.15 0.27 112 IJTSRD | May-Jun 2017 Available Online @www.ijtsrd.com
International Journal of Trend in Scientific Research and Development, Volume 1( International Journal of Trend in Scientific Research and Development, Volume 1(4), ISSN: www.ijtsrd.com : Results of Pooled ANOVA for MRR ), ISSN: 2456-6470 Table 4: Results of SOURCE SS DOF V P SS' F-Ratio Ratio TABLE 68.43 2 34.22 83.17 68.36 977.58 19 Voltage 11.63 2.00 5.81 14.13 11.56 166.11 19.00 Concentration 0.07 POOLED Electrode Gap 2.1515 2 1.0757 2.6150 2.08 30.74 19 Ratio of area 0.07 2 0.04 0.09 11.83 ERROR 82.28 8 100.00 82.28 Total DISCUSSION The effects of various process varia applied voltage, electrolyte concen electrode gap and ratio of area of material removal rate have been obtaining the optimal machining cha glass by using electrochemical discha process. The influence of various proc and their effect on MRR has been anal as electrolyte. iables such as ntration, inter electrode on observed for aracteristics of arge machining cess parameters lyzed on KOH Effect of voltage on MRR: When the voltage increased, current starts flowing more rapidly along the circuit. Th his made the electrons gathered in more number ne ear the tip of Graph 4.1 Effect of v voltage on MRR electrode in lesser time. As a result sp park generated continuously and more rapidly, such h that material If we increase more voltage, it e, it will generate more started removing from the work piec iece. Effect of sparks per unit time and mate aterial will remove more voltage on MRR: quickly. It is done due to a availability of increased When the voltage increased, current starts flowing energy that ionizes the gaseou ous layer at the cathode more rapidly along the circuit. Th his made the causing sparking. electrons gathered in more number ne ear the tip of electrode in lesser time. As a result sp park generated continuously and more rapidly, such h that material started removing from the work piece. 113 IJTSRD | May-Jun 2017 Available Online @www.ijtsrd.com
International Journal of Trend in Scientific Research and Development, Volume 1( International Journal of Trend in Scientific Research and Development, Volume 1(4), ISSN: www.ijtsrd.com trolyte on MRR: ), ISSN: 2456-6470 concentration can produce hug huge variation in MRR as Effect of concentration of electrolyte on MRR: we can analyses from the grap ph. On increasing concentration of electrolyte, number of On increasing concentration of electrolyte, number of OH ion increased. As a result more hydrogen bubbles OH ion increased. As a result more hydrogen bubbles Effect of inter-electrode gap on MRR: formed at the tip of cupper electrode. When this formed at the tip of cupper electrode. When this Form the graph 4.3; it can be e notice that as the gap hydrogen bubbles splitted, spark generated. In other hydrogen bubbles splitted, spark generated. In other between cathode electrode and anode electrode words increasing concentration of electrolyte, spark f electrolyte, spark increased beyond a certain tain value, the MRR starts increased and MRR increased. MRR varies with increased and MRR increased. MRR varies with decreasing. At 20mm, the e e evolved gases tend to concentration of electrolyte. As we can see in the of electrolyte. As we can see in the stabilize the sparking process s but at higher gap it will graph, when concentration was about 25%, the MRR graph, when concentration was about 25%, the MRR destabilize the sparking pro process and hence MRR was just about 4. It increases to 11 on increasing the was just about 4. It increases to 11 on increasing the decreases. concentration from 25% to 35%. So M concentration from 25% to 35%. So MRR increases 3.85 1.8 with increasing concentration of electrolyte. The with increasing concentration of electrolyte. The above graph showing the effect of electrolyte above graph showing the effect of electrolyte 3.8 1.75 S/N Ratio (dB) concentration on MRR is for KOH electrolyte. It’s concentration on MRR is for KOH electrolyte. It’s 3.75 1.7 highly highly reactive reactive and and with with little little increase increase in in 3.7 1.65 concentration can produce huge variation in MRR as concentration can produce huge variation in MRR as we can analyses from the graph. 3.65 1.6 20 40 60 Inter Electrode Gap S/N 5 2.5 4 2 Graph 4.3 effect of inter-ele ectrode gap on MRR S/N Ratio (dB) 3 1.5 Effect of ratio of area of elect lectrode on MRR: MRR 2 1 4.50 1.82 1 0.5 4.00 1.80 0 0 3.50 1.78 S/N Ratio (dB) 25% 35% 45% 3.00 1.76 Concentration of electrolyte S/N S/N 2.50 1.74 2.00 1.72 1.50 1.70 Graph 4.2 Effect of concentration of e f electrolyte on 1.00 1.68 0.50 1.66 MRR 0.00 1.64 1:20 1:40 1;60 Ratio of area of electrode Ratio of area of electrode S/N The above graph showing the effect of electrolyte concentration on MRR is for KOH ele electrolyte. It’s Graph4.4 effect of ratio o MRR of area of electrode on highly reactive and with little e increase in 114 IJTSRD | May-Jun 2017 Available Online @www.ijtsrd.com
International Journal of Trend in Scientific Research and Development, Volume 1(4), ISSN: 2456-6470 www.ijtsrd.com It can be observed from graph 4.4 that as ratio of area of electrode increases i.e. area of cathode to area of anode ratio; MRR increases up to a certain value and then decreases. MRR is highest for the area ratio as 1:40. REFERENCES 1.Rolf Wiithrich : “Micromachining using ANALYSIS electrochemical discharge phenomenon “ To study the significance of the parameters, ANOVA 2.Bhattacharyya, B.N. Doloi, S.K. Sorkhel : is performed. The experimental design according to “Experimental investigations into larger the better which preferred to maximize the electrochemical discharge machining (ECDM) result, and the ideal target value is infinity. To of non-conductive materials” study the significance of the parameters, 3.Alakesh Manna ,Vivek Narang : “A study on ANOVA was performed. It was noted that % micro machining of e-glass–fibre–epoxy contribution of Voltage was highest (83.17) followed composite by ECSM process” by concentration of electrolyte (14.13) and inter 4.Chenjun Wei & Kaizhou Xu & Jun Ni : “A electrode gap (2.615). finite element based model for electrochemical discharge machining “. Table V ANOVA Raw Data 5.R. Wuthrich, V. Fascio : “Machining of non- conducting materials using electrochemical SS D OF V P F-Ratio Para meter V discharge phenomenon—an overview” 9.8066 2 4.9033 84.9130 79945.42 6.Montgomery D. “Design and analysis of C 1.4929 2 0.7464 12.9271 12170.87 experiments (2001)”, John Willey and Sons, 7 1023.913 New York G 0.1256 2 0.0628 1.0875 7.Ross P.J. "Taguchi Techniques for quality R 0.12 2 0.061 1.06 1000.57 engineering (1996)", McGraw Hill, New York Error 0.00 18 0.000 0.01 8.Amitabha Ghosh :”Electrochemical discharge Total 11.5490 26 100.0000 machining: Principle and Possibilities “ 9. Alakesh Manna & Vivek Narang “A study on Where, SS-sum of square, DOF-degree of freedom micro machining of e- glass–fibre–epoxy And V-variance. Fcritical=19.00 composite by ECSM process” Int J Adv Manuf Techno (2012) 61:1191–1197 CONCLUSION DOI10.1007/s00170-012-4094-3; @Springer- Verlag London Limited 2012; Received: 6 From this experimental research few points June 2011/Accepted: 4 January 2012.-1096. were noticed: 115 IJTSRD | May-Jun 2017 Available Online @www.ijtsrd.com
International Journal of Trend in Scientific Research and Development, Volume 1(4), ISSN: 2456-6470 www.ijtsrd.com Received in 7 May 2010; Accepted 20August 15.B. Doloi, B. Bhattacharyya and S. K. Sorkhel 2010.459-465; Received 18 August 2008; (1999), Electrochemical Discharge Machining accepted 9 Jan 10 M. Coteaţă, L. Slătineanu, of Non-Conducting Ceramics, Defence O. Dodun, Ciofu C ,(2008), Electrochemical Science Journal, 49, p. 331-338. 16.M. G. Mostofa, Mohammad Malekian, Simon discharge machining of small diameter holes, Technical University of Gh. Asachi Iaúi. S. Park & Martin B. G. Jun, (2012), 10.Zhi-Wen Fan & Lih-Wu Hourng, (2011), Micromechanical machining of soda lime Electrochemical micro-drilling of deep holes glass, Int J Adv Manuf Techno, 48, p. 4845- by rotational cathode tools, Int J Adv Manuf 4849. 17.Jana D. Abou Ziki, Tohid Fatanat Didar, Rolf Techno, 52, p.555–563. 11.Cheng-kuang Yang, Chih-Ping Cheng, Chao- wuthrich, (2012), Micro-texturing channel Chuang Mai and his co-researchers, (2010), surfaces on glass with spark assisted chemical effect of surface roughness of tool electrode engraving, International Journal Of Machine materials in ECDM performance, Tools and Manufacture, 57, 66-72. International Journal of Machine Tools and Manufacture, 50, p.1088-1096. 12.Xuan Doan Cao, Bo Hyun Kim, Chong Nam chu,(2009), Micro-structuring of glass with features less than 100µm by electrochemical discharge machining” Precision Engineering, 33, p.459-465. 13.Min Seop Han, Byung-Kwon Min, Sang Jo Lee, (2011), Micro-electro discharge cutting of glass using a surface-textured tool” CIRP Journal of Manufacturing Science Technology, 4, p.362-369. 14.Cheng-Kuang Yang, Kun-Ling Wu, Jung- Chou Hung, Shin-Min Lee, Jui-Che Lin, Biing-Hwa Yan., (2010), Effect of process parameters on surface finishing through electrochemical discharge machining using quartz material. International Journal of Machine Tools and Manufacture 50, p.1088- 1096. 116 IJTSRD | May-Jun 2017 Available Online @www.ijtsrd.com