Download
1 / 21
210 likes | 405 Views
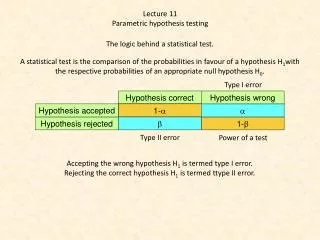
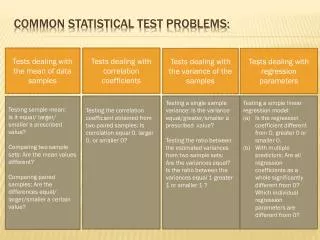
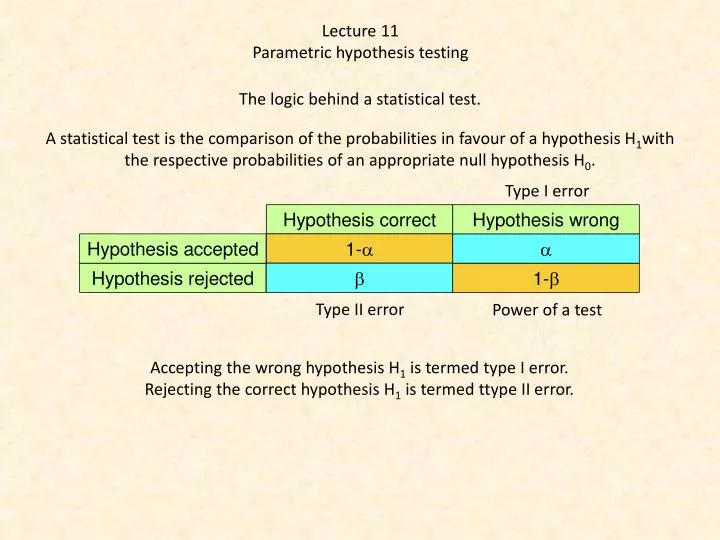
Lecture 11 Parametric hypothesis testing. The logic behind a statistical test. A statistical test is the comparison of the probabilities in favour of a hypothesis H 1 with the respective probabilities of an appropriate null hypothesis H 0 . Type I error. Type II error.

E N D
Lecture11 Parametrichypothesistesting Thelogicbehind a statistical test. A statistical test isthecomparison of theprobabilitiesinfavour of a hypothesis H1with therespectiveprobabilities of an appropriatenullhypothesis H0. Type I error Type II error Power of a test Acceptingthewronghypothesis H1istermedtype I error. Rejectingthe correct hypothesis H1istermedttype II error.
Testing simple hypotheses Karl Pearson threw 24000 times a coin and wanted to see whether in the real world deviations from the expectation of 12000 numbers and 12000 eagles occur. He got 12012 time the numbers. Does this result deviate from our expectation? Theexactsolution of thebinomial Thenormalapproximation
c2 test Assume a sum of variances of Z-transformedvariables Eachvarianceis one. Thustheexpectedvalue of c2is n Thec2distributionis a group of distributions of variancesindependence on thenumber of elements n. Observedvalues of c2can be compared to predicted and allow for statisticalhypthesistesting. Pearson’scoinexample Probability of H0
Doestheobservationconfirmtheprediction? 9 timesgreen, yellowseed 3 timesgreen, greenseed 3 timesyellow, yellowseed 1 time yellow, greenseed The Chi2 test has K-1 degrees of freedom.
All statisticalprogramsgivetheprobability of thenullhypothesis, H0.
Advices for applying a χ2-test • χ2-tests compare observations and expectations. Total numbers of observations and expectationsmust be equal. • The absolute values should not be too small (as a rule the smallest expected value should be larger than 10). At small event numbers the Yates correction should be used. • The classification of events must be unequivocal. • χ2-tests were found to be quite robust. That means they are conservative and rather favour H0, the hypothesis of no deviation. • The applicability of the χ2-test does not depend on the underlying distributions. They need not to be normally of binomial distributed. Dealingwithfrequencies
G-test or log likelihood test c2relies on absolute differences between observed and expected frequencies. However, it is also possible to take the quotient L = observed / expected as a measure of goodness of fit G is approximately c2 distributed with k - 1 degrees of freedom
A species - area relation is expected to follow a power function of the form S = 10A0..3. Do the following data points (Area, species number) confirm this expectations: A1 (1,12), A2 (2,18), A3 (4,14), A4 (8,30), A5 (16,35), A6 (32,38), A7 (64,33), A8 (128,35), A9 (256,56), A10 (512,70)? We try different tests. Bothtestsindicatethattheregressionlinedoesn’t fit Thepatternisbetterseenin a double log plot. We havesevenpointsabove and 3 pointsbelowtheregressionline. Isthere a systematicerror?
Tests for systematicerrors. Thebinomial Thec2 test
Now we trythebest fit model theG-testidentifiedeventhebest fit model as havinglargerdeviationsthanexpectedfrom a simplenormal random sample model.
Thebest fit model Kolmogorov-Smirnov test Observation and expectationcan be compared by a Kolmogorov-Smirnov test. The test comparesthemaximumcumulativedeviationwiththatexpectedfrom a normaldistribution. Bothresultsarequalitativelyidentical but differquantitatively. Theprogramsusedifferentalgorithms
1000 Drosophilaflieswithnormal and curledwings and twoalleles A and B suposed to influence wing form. Predictednumber of allele A and curledwings 2x2 contingency table Do flieswith allele havemoreoftencurledwingsthanfielswith allele B? A contingencytable chi2 test with n rows and m columnshas (n-1) * (m-1) degrees of freedom. The 2x2 tablehas 1 degree of freedom
Relativeabundancedistributions Abundanceisthetotalnumber of individualsin a population. Densityrefers to thenumber of individualsin a unit of measurement. Thehollowcurve Dominant species Thelog-normaldistribution Intermediatespecies Evenness Rarespecies
Thedistribution of speciesabundancedistributionsacrossvertebrates and invertebrates Row and columnsumsareidenticaldue to ourclassification. We expectequalentries for eachcell: 3 types of distributions: log-series, powerfunction, lognormal. We compare 99 suchdistributionsfromallovertheworld.
Do vertebrates and invertebratesdifferinabundancedistributions? Number of log-normalbestfitsonly: But if we takethewholepattern we get
Bivariatecomparisons of means Student’st-testfor equalsamplesizes and similarvariances Welch t-testfor unequalvariances and samplesizes F-test
In a physiological experiment mean metabolism rates had been measured. A first treatment gave mean = 100, variance = 45, a second treatment mean = 120, variance = 55. In the first case 30 animals in the second case 50 animals had been tested. Do means and variances differ? N1+N2-2 Degrees of freedom Theprobabilitylevel for thenullhypothesis
Thecomparison of variances Theprobability for thenullhypothesis of no difference, H0. 1-0.287=0.713: probabilitythatthe first variance (50) islargerthanthesecond (30). One sided test Degrees of freedom: N-1 0.57 2*0.287 Past givestheprobability for a twosided test that one varianceiseitherlargerorsmallerthanthesecond. Twosided test
Power analysis Effectsize In an experiment you estimated two means Each time youtook 20 replicates. Was this sample size large enough to confirm differences between both means? We usethet-distributionwith 19 degrees of freedom. Youneeded 15 replicates to confirm a differenceatthe 5% errorlevel.
From a physiological experiment we want to test whether a certain medicament enhances short time memory. How many persons should you test (with and without the treatment) to confirm a difference in memory of about 5%? We don’tknowthevariances and assume a Poisson random sample. Hence s2 = m Thet-testcan be used to estimatethenumber of observations to detect a significantsignal for a giveneffectsize. We don’tknowthedegrees of freedom: We use a largenumber and get t:
Home work and literature • Refresh: • c2 test • Mendel rules • t-test • F-test • Contingencytable • G-test • Prepare to thenextlecture: • Coefficient of correlation • Maximum, minimum of functions • Matrixmultiplication • Eigenvalue Literature: Łomnicki: Statystyka dla biologów