Download
1 / 14
140 likes | 217 Views
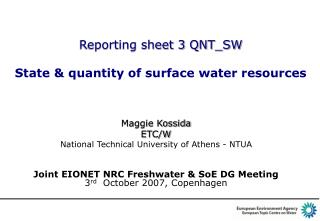
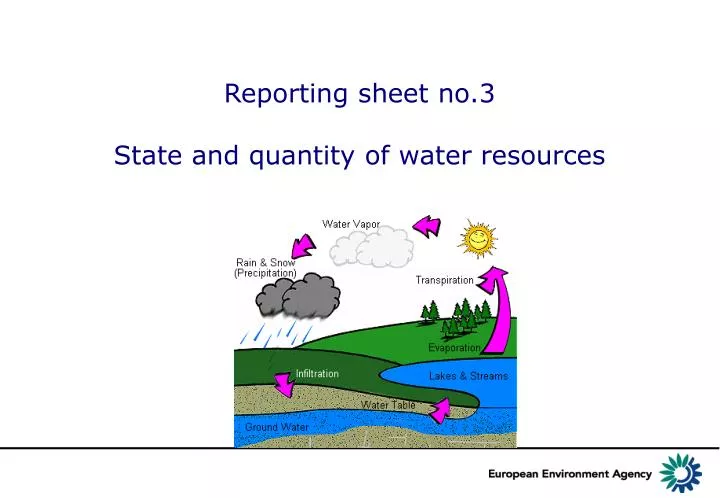
Reporting sheet no. 3 State and quantity of water resources. EEA/European requirements for its assessments on water resources and water use. The European information needed in relation to water quantity can generally be described as:

E N D
EEA/European requirements for its assessments on water resources and water use The European information needed in relation to water quantity can generally be described as: • How much is there? (Runoff, availability, demands, water stress.........) – • Climate change impact on water availability • Getting better or worse? • Pressures on the environment (abstraction and water use by sectors) • Are they working towards targets? such as are water-pricing policies used to provide adequate incentives for users to use water resources efficiently The main policy objectives in relation to water quantity are • To ensure the rates of extraction from our water resources are sustainable over the long term and to promote sustainable water use based on a long-term protection of available water resource
P areal precipitation Qi external inflow ETa actual evapotranspiration Qo total outflow from the territory (Qo = Qo,s + Qo,n) R net recharge into the aquifers C consumptive water use P-ETa = D internal flow (often also referred to as internally generated depth of runoff) The core of information on water availability is the water balance
JRC 2006: FATE & MARS Potential and actual evaporation Long-term precipitation Excess rainfall Mulligan et al 2006: An Atlas of Pan-European Data for Investigating the Fate of Agrochemicals in Terrestrial Ecosystems
Water availability Per capita per country River runoff
Water exploitation index. Total water abstraction per year as percentage of long-term freshwater resources in 1990 and 2002
Eurostat/ OECD Joint Q. Water resource and use at country level Information used by other organisations National montoring and characteri-zation Water quantity information in WISE Reporting sheet Water resource and abstraction Aggregated by RBD WFD Art. 5 & 2010 • SoE reporting • Trend in water abstraction • Water use by sectors • Indicators Reporting sheet River flow Selected gauging stations Hydrological services
Water Framework Directive (WFD) – assessments change from country basis to River Basin District (RBD) Need for River Basin data on: Available water resource (long term annual average (LTAA) values/annual values) • Precipitation (tables; description; trend graphs & maps); • Evaporation (tables; description); • Renewable water resource/water balance (tables; description; & graphs/diagrams); • River run-off (selected gauging stations – LTAA – daily values) • Localisation and characterization of reservoirs (e.g. volume) • Salinisation plants
Water availability at RBD level Source: Jucar pilot river basin report
Water uses by socioeconomic sectors Water uses by sectors Population – Households Population (number, localization, trend/projections) Connection rate to centralized water supply/public water supply Tourism/recreation Public water supply Trend in water uses Agriculture & irrigation Crops grown, Irrigated area Water abstracted for agriculture Industry Economic data Water abstracted Cooling water for energy production and industry Economic or production data Water abstracted WFD Information Water use by sectors – RBD Loire-Britany
Water quantity • projected trends – river flow (2070-2100) A2 scenario HIRHAM RCM