Download
1 / 18
180 likes | 256 Views
Mobile Source Control Strategies. Overview. Reductions from national controls Reduction potential of local mobile controls Perspective. Mobile Emission Reductions from National Controls. Emissions (1,000s kg/day). 37%. 54%. 40%. 54%. 46%. 51%. Additional Mobile Controls.

E N D
Mobile Source Control Strategies
Overview • Reductions from national controls • Reduction potential of local mobile controls • Perspective
Mobile Emission Reductions from National Controls Emissions (1,000s kg/day) 37% 54% 40% 54% 46% 51%
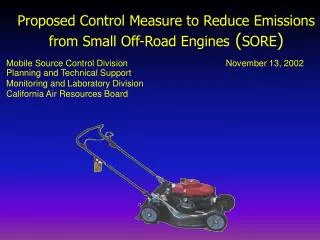
Additional Mobile Controls • Fuel Changes • I/M Programs • Transportation Control Measures
Mobile VOC Reductions from National Controls Emissions (1,000s kg/day) 54% Year
Additional VOC Reductions With I/M Programs Emissions (1,000s kg/day) 4% 6% 12%
Mobile NOx Reductions from National Controls Emissions (1,000s kg/day) 54% Year
Additional NOx Reductions With I/M Programs Emissions (1,000s kg/day) 0% 3% 7% Year
I/M Policy Issues • Low reductions from non-OBD programs • Assume OBD is effective technology • OBD benefits may be overestimated • How does this compare to other options?
VMT and Emissions Trends VMT (millions/day) Mobile Emissions (1,000s kg/day) Year
Additional VOC Reductions With VMT Changes Mobile Emissions (1,000s kg/day) 4.7% Year
Additional NOx Reductions With VMT Changes Mobile Emissions (1,000s kg/day) 4.8% Year
Additional VOC Reductions With Doubling of Transit Mobile Emissions (1,000s kg/day) 1.0% 4.7% Year
Additional NOx Reductions With Doubling of Transit Mobile Emissions (1,000s kg/day) 0.4% 4.5% Year
TCM Policy Issues • Projected benefits less certain • Emissions show little sensitivity to VMT changes • Success dependent on behavioral changes – Enforceable? • Regulatory vs. voluntary
Conclusions • National controls are producing major reductions • Additional reductions from local controls are small in comparison • I/M (OBD) benefits in similar range as fuels • Changes in VMT have diminishing impacts
Decision-Making Questions • What are we trying to accomplish? • Are there common denominators in the answer to that question? • Is there “value-added” by implementing some programs in multi-state areas?