Download
1 / 68
770 likes | 1.96k Views
Traffic Engineering and Management. By V.Venkataramana Asst. P rofessor RGUKT-RK Valley. Traffic Measurement Procedures. Introduction. The data required by a traffic engineer can mainly be observed on field rather than at laboratory .

E N D
Traffic Engineering and Management By V.Venkataramana Asst. Professor RGUKT-RK Valley
Introduction • The data required by a traffic engineer can mainly be observed on field rather than at laboratory. • Now the field studies can be classified into three types: • 1. Measurement at a point • 2. Measurement over a short section • 3. Measurement over a long section
1. Measurement at a point • Flow is the main traffic parameter measured at a point. • Flow can be defined as the no of vehicles passing a section per unit time. • Traffic volume studies are mainly carried out to obtain factual data concerning the movement of vehicles at selected point on the street or highway system.
Traffic VolumeStudy • It is used as a quantity measure of flow: the commonly unitsare vehicles/day orvehicles/hour • Object and Uses of Traffic VolumeStudy: • It is generally accepted as a true measure of the relative importance of roads and in deciding the priority for improvement and expansion. • It is used in planning, traffic operation and control of existing facilities and also for planning the newfacilities. • It is used in the analysis of traffic patterns andtrends. • Useful in structural design ofpavement • Pedestrian traffic volume study is used for planning side walk, cross walks, subway and pedestriansignals
Main Methods ofCounting • 1. Direct Method • 2. IndirectMethod ManualCounting Method • 1. Contact System • 2. Contact-lessSystem Automatic CountingMethod
ManualMethod • Counts are typically used to gather data for determination of vehicle classification, turning movements, direction of travel, pedestrian movements, or vehicle occupancy. Most applications of manual counts require small samples of data at any givenlocation. • Manual counts are sometimes used when the effort and expense of automated equipment are not justified. Manual counts are necessary when automatic equipment is not available. • Manual counts are typically used for periods of less than a day.Normal intervals for a manual count are 5, 10, or 15 minutes. • Traffic counts during a Monday morning rush hour and a Friday evening rush hour may show exceptionally high volumes and are not normally used in analysis; therefore, counts are usually conducted on a Tuesday, Wednesday, or Thursday.
Manualcounts • A manual classified count (MCC) involves counting all the vehiclespassingaselectedlocationonaroadforapre-determined period oftime. • The count is conducted by persons standing at the roadside and recording passing vehicles on a form, hence the term “manual traffic count”. This distinguishes it from counts by machines that can record passing vehicles automatically, which are know as “automatic trafficcounts”. • The count records individual vehicles by categories (i.e. a truck or car) and the direction they are travelling in. This is the reason it is called a ‘classifiedcount’.
Manual method • Employs a field team to count and classify trafficvolume • No. of observers required depends upon no. of Lanes and type of informationrequired. • Moredesirabletorecordtrafficineachdirectionoftravel • by posting separate observers for eachdirection. • For all-day counts ,work in three shifts can bearranged. • Data is recorded by Five- dash system.(IIII)
Equipments for manualcounts • Watch • clipboard • Pencil, rubber, shapner • Datasheet
Manual Count RecordingMethods • TallySheets • Recording data onto tally sheets is the simplest means of conducting manual counts. The data can be recorded with a tick mark on a pre-prepared field form. A watch or stopwatch is necessary to measure the desired count interval.
Details such as vehicle classification and no. of occupants can beobtained. • Records Turning movement data of vehicles atintersections. • Analyzing traffic characteristics in unusual conditions such as adverse weather conditions, traffic breakdowns, temporary closure of any lane of highwayetc. • Comparatively cheaper method ofcounting. • Data accumulated by manual methods are easy toanalyze.
Notpracticabletohavemanualcountfor24hrsofthedayand throughout theyear. • Counts of remote areas is possible by automaticdevices.
Automatic CountingMethods • An automaticsurveyinvolves placing a tube or loop across aroad which is connected to a box containing the means for storing the information. • In this method, vehicles are counted automatically without any human involvement. • There are two techniques of automaticcounting: • Contact system based on pneumatic, mechanical, magnetic or • contactless system based on electrical/optical, ultrasound/infrared radar, micro wave, CCTV/video images processing methods etc.
AutomaticMethod • T1h9e automatic count method provides a means for gathering large amounts of traffic data. Automatic counts are usually taken in 1- hour intervals for each 24-hourperiod. • The counts may extend for a week, month, or year. When the counts are recorded for each 24-hour time period, the peak flow period can beidentified. • Automatic counts are recorded using one of three methods: • portable counters, permanent counters, and videotape
AutomaticMethod PortableCounters • Portable counting is a form of manual observation. Portable counters serve the same purpose as manual counts but with automatic counting equipment. The period of data collection using this method is usually longer than when using manual counts. The portable counter method is mainly used for 24-hourcounts. • Pneumatic road tubes are used to conduct this method of automatic counts Specific information pertaining to pneumatic road tubes can be found in the users’manual.
AutomaticMethod • PermanentCounters Permanent counters are used when long-term countsare to be conducted. The counts could be performed every day for a year or more. The data collected may be used to monitor and evaluate traffic volumes and trends over a long period oftime. • Videotape orVideography Observers can record count data by videotaping traffic. Traffic volumes can be counted by viewing videotapes recorded with a camera at a collection site. A digital clock in the video image can prove useful in noting timeintervals.
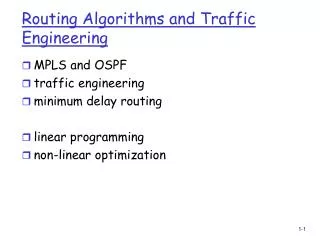
Pneumatic roadtube • Pneumaticroadtubesensorssendaburstofairpressurealongarubbertubewhenavehicle's tires pass over thetube. Figure : Pneumatic RoadTube
Bendingplate • A weight pad attached to a metal plate embedded in the road to measure axelweightand speed. It is an expensive device and requires alteration to the roadbed.
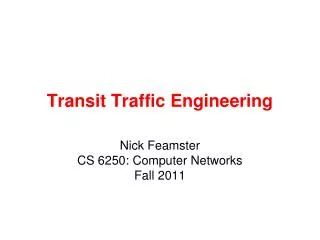
Vehicles counting by video camera(a) Vehicles counting by video camera(b)
Factors affecting vehiclecounting • Weatherconditions. • Purpose of the trafficcounting. • Method of trafficcounting. • Location of the countingsites. • Traffic flowlevel. • Road type. • Trafficcomposition
Traffic flow maps: • Show volume along various routes by using bands using proportional to traffic volume carried • Thickness of lines represent traffic volume. • Intersection Flow Diagrams • Give direction and volume of traffic through an intersection. • Trend charts • Showsthehourly,dailyormonthlychangesinvolumethrough an area. • Useful for planning future expansion, design and regulation. • 31
Annual Average DailyTraffic(AADT) • The total yearly volume dividedby number of days in theyear. • Average DailyTraffic(ADT) • The total volume during a given time period, in whole days greater than one day and less thanone year,dividedbynumber of days in that timeperiod.
Passenger CarUnit The different vehicle classes have a wide range of static characteristics and dynamic characteristics, apart from these the driver behavior of the different vehicle classes is also found to vary considerable. Therefore mixed traffic flow characteristics are very much complex when compare to homogeneous traffic and it is difficult to estimate the traffic volume, capacity of roadway under the mixed traffic flow, unless the different vehicle classes are converted to one common standard vehicleunit. • Therefore it is a common practice to consider the passenger car as the standard vehicle unitto convert the other vehicle classes and this unit is called passenger car unitPCU.
It is a common practice to consider the passenger car as the standard vehicle unit to convert the other vehicle classes and this unit is called Passenger car unit orPCU. Thus in mixed traffic flow, the traffic volume & capacity are generally expressed as PCU per hour or PCU/lane/hour & the traffic density as PCU per kilometer length oflane.
Measurement over a Short Section • Speed measurements are most often taken at a point (or a short section) of road way under conditions of free flow. • used to determine general speed trends, to help determine reasonable speed limits, and to assess safety.
Speed Studies • As speed defines the distance travelled by user in a given time, and this is a vibrant in every traffic movement. • The actual speed of traffic flow over a given route may fluctuated widely, as because at each time the volume of traffic varies • Accordingly, speeds are generally classified into three main categories
Speed • Spot speed This is the instantaneous speed of a vehicle at any specific location. • Running speed :This is the average speed maintained over a particular course while the vehicle is in the motion. • Journey speed: This is the effective speed of the vehicle on a journey between two points and the distance between two points and the distance between these points divided by the total time taken for the vehicle to complete the journey, it includes all delay.
Spot Speed Studies • A spot speed is made by measuring the individual speeds of a sample of the vehicle passing a given spot on a street or highway • Spot speed studies are used to determine the speed distribution of a traffic stream at a specific location • The data gathered in spot speed studies are used to determine vehicle speed percentiles, which are useful in making many speed-related decisions
Spot Speed Studies • Spot speed data have a number of safety applications, including the following 1. Speed trends, 2. Traffic control planning, 3. Accidental analysis, 4. Geometric design, 5. Research studies
Methods of Measurement • Methods of conducting spot speed Studies are divided into two main categories: Manual and Automatic • Methods of conducting spot speed Studies are divided into two main categories: Manual and Automatic.
Manual Method • Spot speeds may be estimated by manually measuring the time it takes a vehicle to travel between two defined points on the roadway a known distance apart (short distance),usually less than 90m. • Distance between two points is generally depending upon the average speed of traffic stream.
Manual Method • Pavement markings • In this method, markings of pavement are placed across the road at each end of trap. • Observer start and stops the watch as vehicle passes lines. • In this method, minimum two observers required to collect the data, of which one is stand at the starting point to start and stop the stop watch and other one is stand at end point to give indication to stop the watch when vehicle passes the end line
Manual Method • Pavement markings • disadvantage of this is that substantial error can be introduced • this method is only applicable for low traffic conditions
Manual Method-Enoscope or Mirror box • Also known as mirrorbox • L-shaped box, open at both ends ,with a mirror set at 45 ˚ to the arms of theinstrument.
Enoscope • Itbendsthelineofsightoftheobserverperpendiculartothe path of the vehicle vehicle mirror 45˚ observer
Enoscope • The instrument is placed directly opposite to the first reference point and the observer stations himself at the second reference point. • Stop watch is started as soon as the vehicle passes the first point and is stopped as soon as it passes theobserver. • If two enoscope is used, the observer stations himselfmidway between two referencepoints. • Advantages: • Equipment is of low cost, simple and can set up easily and eliminate the errors due to parallax • under heavy traffic condition it may be difficult
Automatic Methods-Doppler-Principle Meters (Radar) • Works on the Dopplerprinciple. • Speed of a moving body is proportional to change in frequency between the Radio wave transmitted to the moving body and the radio wave receivedback. • Instrument directly measuresspeed. • Instrument is setup near the edge of carriageway at a height of1m. • The speedmeterissokeptthattheangle between direction of travel of vehicle and axis of transmission of radio wave is as low as possible, say within 20˚. • Speed of vehicles in both directions can beobserved.
Electronic-Principle Detectors (Photography) • Time-lapse camera photography can beused. • Photographs are taken at fixed intervals of time(say one second per frame) on a special camera. • By projecting the film on a screen, thepassage of any vehicle can be traced with reference totime. • Images by video cameras can be alsoused.
Data Collection Sheets • The measured data by the above techniques should be collected into some formats, following are the some types of data collection sheets which are used for manual and automatic methods 1. For Enoscope and Pavement Marking Methods 2. For automatic methods