Download
1 / 28

E N D
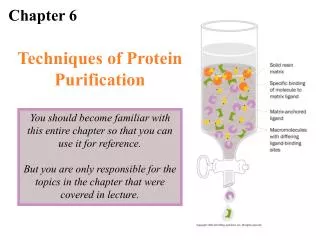
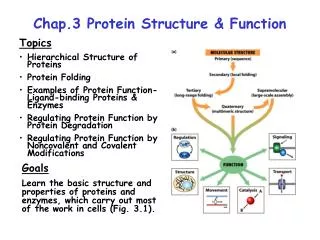
1. Chapter 5: Protein Function Dr. Clower
Chem 4202
2. Functions of Proteins
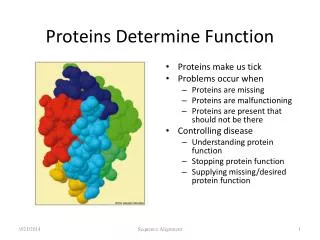
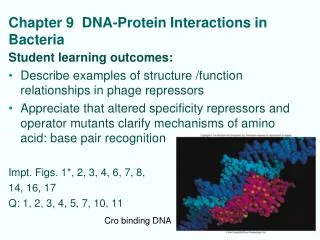
3. Protein Function Very specific biological function
Varies based on structure
Fibrous proteins
Enzymes
Transport across membranes
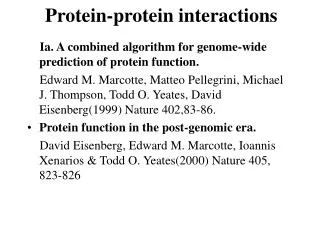
Common theme: how proteins bind to interact with other molecules
Involves reversible binding with ligands (or substrates) in binding site (or active site)
Can have multiple binding sites in one protein
Binding may involve change in conformation (induced fit)
Induced fit may cause change in other parts of the protein (e.g. other subunits)
Interactions between ligands and proteins are regulated
4. Model Proteins Myoglobin and Hemoglobin
Oxygen-binding proteins
Transport
Increase solubility of O2 in aqueous environment
First 3D structures determined
5. Myoglobin Mb
Transport protein
Primarily in muscle tissue
Structure
Small, globular
153 residues
8 a-helices (A-H) connected by bends (AB, etc.)
Contains one heme group
Prosthetic group
Binds in hydrophobic pocket
6. Heme Found in O2 transport proteins and electron-transfer proteins (cytochromes)
Heterocyclic porphyrin ring system
Conjugated
Flat
Binds divalent ion
e.g. Fe2+
Located deep in protein structure to prevent oxidation of ion
Between E and F helices
Held in place by hydrophobic interactions (Phe, Val)
7. Heme Iron has 6 coordination bonds
4 to pyrrole groups
1 to His residue
Proximal His
F8; His93
1 to O2 or other small molecule (CO, NO)
8. Binding of Oxygen Equilibrium
Ka = association constant
Not the same as acid dissociation constant
Measure of affinity of L for P
Higher Ka = higher affinity
Kd = dissociation constant
Lower Kd = higher affinity
Fractional saturation (q)
Fraction of ligand-binding sites occupied by L
9. Kd = [L] at which � binding sites occupied
Protein is half-saturated
Lower Kd = smaller [L] required due to stronger binding between L and P
10. Reversible Binding of O2 to Mb Equilibrium expression
Kd expression
Substitute [O2] = pO2
Partial pressure
Easier to measure
Substitute Kd = [O2]0.5
Concentration at which � sites occupied
P50
Expression for q
11. Plot of q vs. pO2 for Mb Low pO2 = low binding
Increase pO2 = increased binding until saturated
12. Steric Factors O2 vs. CO binding
Free heme vs. Mb heme
Distal His = E7 (His 64)
13. Hemoglobin Hb
Closely related to Mb
More O2 transport
Multiple subunits
Multiple binding sites
Responsiveness to changes in pO2
14. Hb Structure Spherical
Tetrameric protein
Quaternary structure = aabb
a = 141 residues
b = 146 residues
Both a and b similar to Mb
Structure, not sequence
15. Amino Acid Sequences of Mb and Hb
16. Hb Structure Dimer of ab protomers
Rotational symmetry
17. Hb structure a and b units attract at interfaces
a1b1 and a2b2
35 residues
a2b1 and a1b2
19 residues
Typically hydrophobic
Also electrostatic and H-bonding
a1a2 and b1b2 little or no interaction
Separated by solvent channel
Each subunit binds a heme
Between E and F helices
Heme binds O2
Structure changes when O2 binds
18. T State Deoxyhemoglobin
Very little O2 affinity
Some electrostatic interactions
19. R State Oxyhemoglobin
Higher affinity of O2
ab dimer rotates ~15�
a2b1 and a1b2 contacts shift
b chains closer together
Some ion pairs broken
20. O2 Binding to Hb pO2 higher in lungs than in tissue
O2 needs to bind, then release
This will not happen with Mb
hyperbolic curve; animation
Hb transitions T to R state as more O2 binds
Cooperative interaction between binding sites
Binding to one site affects binding to the other sites
One O2 molecule binding increases O2 affinity of other sites
Allosteric protein
21. Plot of q vs. pO2 for Hb Hb described by sigmoidal curve
At low pO2, sites compete for first O2 ligand and weak binding in T state
Slope increases quickly due to increased affinity of other sites (T ? R)
Becomes saturated
22. Hill Equation Describes sigmoidal curve
Expression for q
n = number of binding sites
Hill plot
nH = slope = Hill coefficient
Measure of degree of cooperativity (interaction between binding sites)
Solving Hill equation shows that the 4th ligand binds with 100x greated affinity than 1st ligand
23. Hill Plot nH = 1
Hyperbola (like Mb)
Ligand binding is not cooperative
nH > 1
Positively cooperative (like Hb)
Upper limit = n (4 for Hb; typical nH ~2.8-3.0; upper limit never reached)
nH < 1
Negatively cooperative
Reduce affinity when first ligand binds
24. Explanation for Cooperative Interaction Why does ligand affinity increase?
How does one heme affect the others?
Not through electronic mechanism
Hemes too far apart (25 � 37 �)
Due to change in structure upon oxygenation
Perutz mechanism
Change from T state conformation to R state conformation
25. Perutz Mechanism Very fast
1. Fe(II) in T state site above heme
Fe(II) binds to O2
Fe(II) pulled down into heme (R state)
2. Fe(II) pulls down His F8
F helix tilts
Animation
26. Perutz Mechanism 3. Shift of tertiary structure causes shift of quaternary structure (rotate)
a2b1 and a1b2 interface residues realign
C-terminal residues break ionic interactions which stabilize T state
As R state forms from T state, it adopts ideal conformation for next O2 binding
All binding sites are altered, not just the one binding the O2
27. Bohr Effect Conformational change will be accompanied by change in IF�s
Change in charge
Also, H+ and O2 compete for binding to Hb
Relate pH to affinity
Bohr effect
O2 affinity increases as pH increases
Animation (YO2 = q)
28. Regulation of O2 Binding O2 affinity affected by other molecules which can bind to the protein
CO2
D-2,3-bisphosphoglycerate (BPG)
Binds to T state (central cavity)
Does not bind to R state
Keeps Hb in deoxy form
Decreases O2 affinity
Allow ligand to be released
Animation
29. Chapter 5 Problems 1-6