Download
1 / 70
700 likes | 795 Views
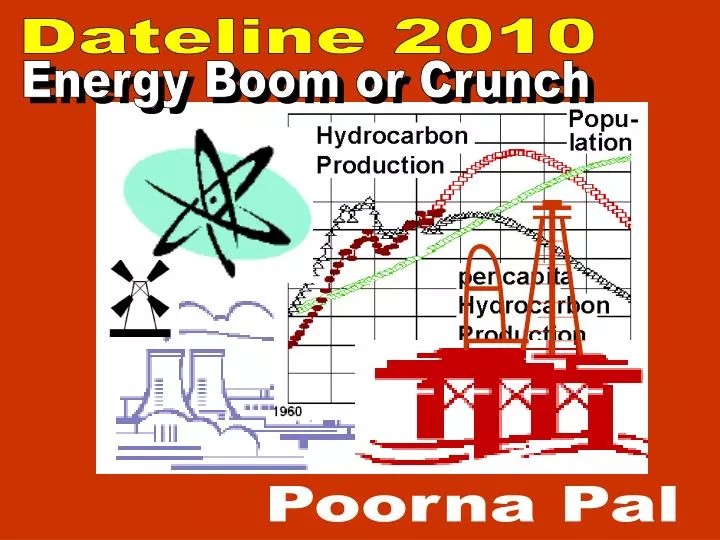
Dateline 2010. Energy Boom or Crunch. Energy Boom or Crunch. Poorna Pal. Energy matters because it. defines the modern technological society; is essential for economic growth; and therefore governs our continued economic well being.

E N D
Dateline 2010 Energy Boom or Crunch Energy Boom or Crunch Poorna Pal
Energy matters because it ... • defines the modern technological society; • is essential for economic growth; and therefore • governs our continued economic well being.
Average daily per capita energy use at the various stages of human cultural development Average daily per capita energy use at the various stages of human cultural development Daily per capita consumption in kcal Farming & Industry Trans- portation Food Home Industrial societies Advanced agri- cultural societies Early agri- cultural societies Hunter-gatherer societies Primitive societies 0 20 40 60 80
Economic prosperity and energy consumption are closely correlated 100 USA China Russia Germany India Japan 10 Brazil Italy France U.K. Energy Consumption (terrajoules) (E) Mexico Saudi Arabia Netherlands Spain Australia Sweden 1 Norway Swtizerland Singapore 0.1 0.01 0.1 1 10 GDP (PPP) in trillion US $ (Y)
BusinessWeek February 24, 2003
Why 2010? • Oil is the dominant source of energy, and is likely to remain so for the foreseeable future, • but faces the ubiquitous threat of exhaustibility — analysis of Hubbert’s peak suggests that annual production would start falling by 2004-10.
Fossil fuels (oil, natural gas and coal) are likely to remain the dominant source of energy world-wide Renewables (6%) Nuclear (9%) Oil (43%) Coal (21%) Renewables (4%) Nuclear (7%) Natural Gas (21%) Coal (18%) Oil (43%) Natural Gas (28%) 2000 2020 World Energy Use, by Source eia.doe.gov
U.S. Energy Consumption History and Outlook http://www.eia.doe.gov/emeu/aer/ep/source.html History Projection 50 40 30 Quadrillion Btu 20 10 0 1950 1960 1970 1980 1990 2000 2010 2020
World Energy Consumption by Fuel Type, 1970-2020 Quadrillion BTUs
Energy Consumption in the Developing World, by Region, 1970-2020 Quadrillion Btu Sources: 1995-1999: Energy Information Administration (EIA), International Energy Annual 1999. DOE/EIA-0219(99) (Washington, DC, February 2001). Projections: EIA, World Energy Projection System (2002).
'THE END OF THE OIL AGE is in sight,' said the petroleum geologist M. King Hubbert.... If present trends continue, Dr. Hubbert estimated, production would peak in 1995 -- the deadline for alternative forms of energy that must replace petroleum in the sharp drop-off that follows. Oil, the Dwindling Treasure M. King Hubbert National Geographic, June, 1974
King Hubbert is best known for his startling prediction, first made public in 1949, that the fossil fuel era would be of very short duration. ("Energy from Fossil Fuels: Science, Feb 4, 1949”). His subsequent prediction in 1956 that U.S.oil production would peak in about 1970 and decline thereafter was scoffed at then but has since proved to be remarkably accurate. In a subsequent article in the Scientific American (1971), he argued that 80% of the world’s petro- leum reserves will be exhausted by the year 2029-35. World reserves = 2.1 trillion barrels World reserves = 1.3 trillion barrels
Hubbert’s Peak:The Impending World Oil Shortage by Kenneth S. Deffeyes (Princeton University Press, 2001) Were the energy concerns of the past year a preview of everyone’s future? Will gas lines in the coming years make those of 1973 look short? Is the present chaos in oil prices the leading edge of a more serious crisis that will rock national economies around the world? According to Kenneth Deffeyes, a geologist with extensive personal experience in the oil industry, the answer to all of these questions is yes. World oil production is peaking and will start to fall for good sometime during this decade. The geophysicist M. King Hubbert was amazingly accu-rate when he predicted, in 1956, that U.S. oil production would peak in 1970. That actually happened in 1971! Using the same methods, Dr. Deffeyes shows that the peak in world oil production is likely to occur by 2004-10. What is worse, he argues, is that long-term mitigation efforts like alternate energy sources may not get launched in time to avert a short-term catastrophe.
No need to worry about petroleum reserves … Our latest sport utility vehicle is equipped with its own drilling rig!
How Much Oil Do We Really Have? Resource availability is a function of • Technology, and the • Supply-Demand Equilibrium
Resources Perpetual or Renewable Exhaustible or Nonrenewable Wind, tides, flowing water Direct solar energy Non- metallic minerals Fossil Fuels Metallic minerals • Hydro-carbons(Oil, Natural Gas) • Coal Potentially renewable Fresh air Fresh water Fertile soil Bio- diversity
How Geologists Find Oil Oil forms from the decomposition of shallow marine microorganisms. Therefore, geologists look for • Reservoir Rock — Permeable • Source Rock — Organic Rich • Oil Trap — Oil “Pools” Collect in Traps
Oil Traps Oil is lighter than water, and therefore rises to-wards the surface, e.g., an anticlinal trap. Axis of Syncline Axis of Anticline Limb Axial Plane
Common oil traps: • Anticlines • Faults • Salt domes • Stratigraphic A B C D
The depletion curve for a typical nonrenewable resource Depletion Time (TE) = The time when 80% of the resource is used up 80% Time
Fraction used up Fraction remaining f 1 - f f 1 - f = Then y = ln f1 = A + Bt where f1are the observed data as function of time (t), so that the constants A and B can be found by linear regression analysis. f1 eA+Bt Write = =
Logistic or Hubbard curves for the U.S. oil output and prospects using Logistic or Hubbard curves for the U.S. oil output and prospects using 4 1995 resource estimate 1986 resource estimate 3 2 1 Actual Production 0 1950 2000 2050
U.S. oil production (1857-1995) U.S. oil production (1857-1995) 1.00 4 Cumulative production as the share of 1986 resource estimate 0.75 3 Actual production 0.50 2 Annual production (billion barrels) Cumulative share produced Cumulative production as the share of 1995 resource estimate 1 0.25 0.00 0 1850 1900 1950 2000 2050
Current Reserves 1.1 TBO 0.8 TBOE 1.9 TBOE Current Consumption 0.028 TBO/yr 0.014 TBOE/yr 0.044 TBOE/yr Total Reserves 3.0 TBO 2.6 TBOE 5.6 TBOE 1.0 TBOE Petroleum Natural gas Total USGS World Petroleum Assessment 2000 (excluding U.S.) Already Consumed: http://www.usgs.gov/public/press/public_affairs/press_releases/pr1183m.html • News Release: March 22, 2000 • AAPG Distinguished Lecture • Downloadable WEP data summary and Map
World’s Oil and Natural Gas Endowment U.S. Non-U.S. World 83 BBO 76 BBO 32 BBO 171 BBO 362 BBO 88 BBOE 59 BBOE 29 BBOE 142 BBOE 318 BBOE 680 BBOE 649 BBO 612 BBO 859 BBO 539 BBO 2,659 BBO 778 BBOE 551 BBOE 770 BBOE 150 BBOE 2,249 BBOE 4,908 BBOE 732 BBO 688 BBO 891 BBO 710 BBO 3,021 BBO 866 BBOE 610 BBOE 799 BBOE 292 BBOE 2,567 BBOE 5,588 BBOE Oil: Undiscovered (conv.) Reserve growth (conv.) Remaining resources Cumulative production Total Natural Gas: Undiscovered (conv.) Reserve growth (conv.) Remaining resources Cumulative production Total Total Oil & NaturalGas Endowment:
Hubbard curves for world petroleum output and prospects assuming resource estimates of 60 3.0 x 10¹² barrels 2.2 x 10¹² barrels 1.4 x 10¹² barrels 40 Actual 20 Production 0 1900 2000 2100
If the oil supplies are facing an immediate decline then we can be expected to observe • an appreciable drop in their reserves, and • a concomitant rise in their prices.
Malcolm Mayes, Edmonton, Alberta, Canada-- The Edmonton Journal.
4.0% $50 3.5% $40 3.0% $30 Fraction of Proved Reserves Used (per year) Real Price of Crude Oil (per barrel) 2.5% $20 2.0% $10 1970 1980 1990 2000 Prices would rise if the supplies fall, relative to demand. The correlation of oil prices with the extraction rate has been rather weak, however, and points more to market manipulation than to free market economics.
3 USA 1 China Russia 0.3 Japan Ukraine Poland Australia India Germany Canada U.K. 0.1 Kazakstan Italy France South Africa Brazil North Korea South Korea Mexico 0.03 Iran 0.03 0.1 0.3 1 3 10 ...and so are economic prosperity and carbon emmissions GDP (PPP) in trillion US $
World Energy Consumption by Region, 1970-2020 Quadrillion BTUs
World Energy Intensity by Region, 1970-2020 Thousand BTUs per 1997 GDP$
http://www.bp.com/company_overview/technology/frontiers/fr04aug02/fr04hydrogen.asphttp://www.bp.com/company_overview/technology/frontiers/fr04aug02/fr04hydrogen.asp
WITHOUT NEW POLICIES: Oil Consumption Will Keep Growing … As U.S. Dependence On Imports Increases … Transferring Wealth To The Middle East
CURBING AMERICA’S OIL ADDICTION The U.S. can’t achieve energy dependence anytime soon — nor is it necessary. These steps will reduce our vulnerability to oil shocks and other political developments in the Middle East. They also will strengthen U.S. industries and reduce carbon emissions linked to global warming.
Oceans as the energy reservoir • Already, about one-third of oil comes from the oceans, advances in drilling technology will increase that. • Other ocean-based energy sources include • Methyl hydrate gel • Ocean Thermal Energy Conversion (OTEC) or thermocline • Kelp farming for methane • Tides, Waves etc.