Download
1 / 5

E N D
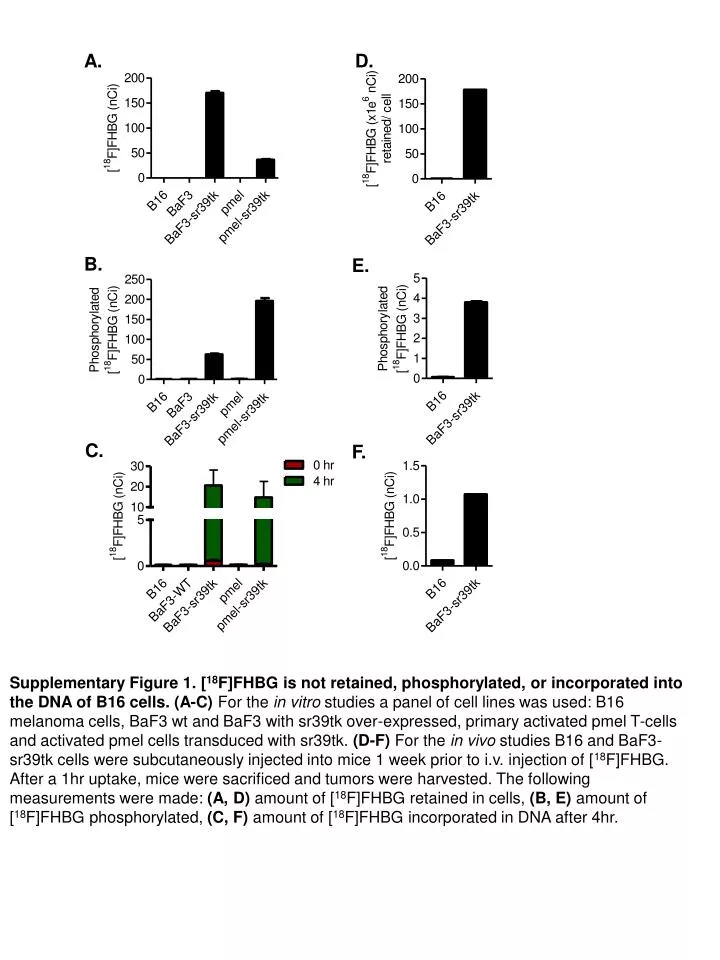
A. D. B. E. C. F. Supplementary Figure 1. [18F]FHBG is not retained, phosphorylated, or incorporated into the DNA of B16 cells. (A-C) For the in vitro studies a panel of cell lines was used: B16 melanoma cells, BaF3 wt and BaF3 with sr39tk over-expressed, primary activated pmel T-cells and activated pmel cells transduced with sr39tk. (D-F) For the in vivo studies B16 and BaF3-sr39tk cells were subcutaneously injected into mice 1 week prior to i.v. injection of [18F]FHBG. After a 1hr uptake, mice were sacrificed and tumors were harvested. The following measurements were made: (A, D) amount of [18F]FHBG retained in cells, (B, E) amount of [18F]FHBG phosphorylated, (C, F) amount of [18F]FHBG incorporated in DNA after 4hr.
1.3 1.3 1.3 1.3 1.3 1.3 0.3 0.3 0.3 0.3 0.3 0.3 Day 5 Day 3 Day 10 Day 1 Day 8 Mouse 1 C C C %ID/g A T B B T T B B B B Day 17 Day 15 Day 21 Day 12 Day 19 %ID/g A B B B T T T T T B B B Mouse 2 Day 5 Day 3 Day 10 Day 1 Day 8 C %ID/g B B A T T T B Day 17 Day 15 Day 21 Day 12 Day 19 C C C %ID/g A B B A T T T T Mouse 3 Day 5 Day 3 Day 10 Day 1 Day 8 %ID/g A A A A T T T T Day 17 Day 15 Day 21 Day 12 Day 19 %ID/g A B T T T T B
1.3 1.3 1.3 1.3 1.3 1.3 0.3 0.3 0.3 0.3 0.3 0.3 Mouse 4 Day 5 Day 3 Day 10 Day 1 Day 8 C C C %ID/g B B B B T T T B Day 17 Day 15 Day 21 Day 12 Day 19 %ID/g T B T T T A T Mouse 5 Day 5 Day 3 Day 10 Day 1 Day 8 %ID/g B B B A T A B T B T T Day 17 Day 15 Day 21 Day 12 Day 19 %ID/g A T B T T T A Mouse 6 Day 5 Day 3 Day 10 Day 1 Day 8 %ID/g T T T B Day 17 Day 15 Day 21 Day 12 Day 19 %ID/g B T A T T T
1.3 1.3 0.3 0.3 Mouse 7 Day 5 Day 3 Day 10 Day 1 Day 8 %ID/g B B B T B B T Day 17 Day 15 Day 21 Day 12 Day 19 %ID/g B T T T T Supplementary Figure 2. Longitudinal changes in T cell trafficking. Seven mice were imaged with microPET/CT 60 min after i.v. injection with [18F]FHBG. Representative 3-D microPET/CT images of the same mouse on different days are displayed. Red arrows indicate days that mice received gp10025-33/DC vaccine and high dose IL-2. A, axillary LN; B, brachial LN; C, cervical LN; T, tumor
1.7 1.7 1.7 0.1 0.1 0.1 A. B16 + sr39tk+ T-cell B16 alone %ID/g Mouse #1 B. C. Mouse #2 %ID/g T T Mouse #3 %ID/g T T [18F]FHBG PET [18F]FHBG PET Intratumoral injection of sr39tk+ T-cells T T B16 melanoma bearing mouse Supplementary Figure 3. Detection of sr39tk+ T-cells over the nonspecific accumulation of [18F]FHBG in B16 tumors. (A) C57BL/6 mice were implanted s.c. with 1 x 10⁵ B16 cells in the right shoulder on day 1. Mice with tumors >1cm in diameter were imaged with [18F]FHBG microPET/CT on day 8. Immediately after imaging, 5x10⁶ sr39tk+ T-cells were injected intra-tumorally. After 30 min, a second dose of [18F]FHBG was injected i.v.. Following a 1hr uptake of the probe mice were again imaged by microPET/CT. (B) Representative 3-D microPET/CT images of three mice with B16 tumors alone (left panels) and the same B16 tumors with sr39tk+ T-cells (right panels). T, tumor. (C) Quantitation of [18F]FHBG in B16 tumors alone and the same B16 tumors with sr39tk+ T-cells.